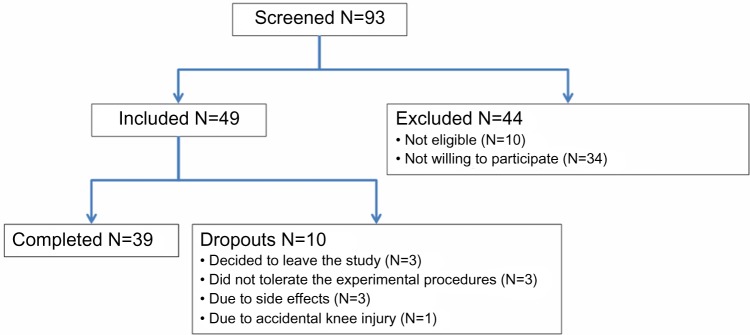
Figure 2.

Flow diagram of the study.
Notes: The diagram explicitly shows the number of screened, excluded, included, dropout, and completed participants. All completed participants were included in the primary data analysis.

Flow diagram of the study.
Notes: The diagram explicitly shows the number of screened, excluded, included, dropout, and completed participants. All completed participants were included in the primary data analysis.