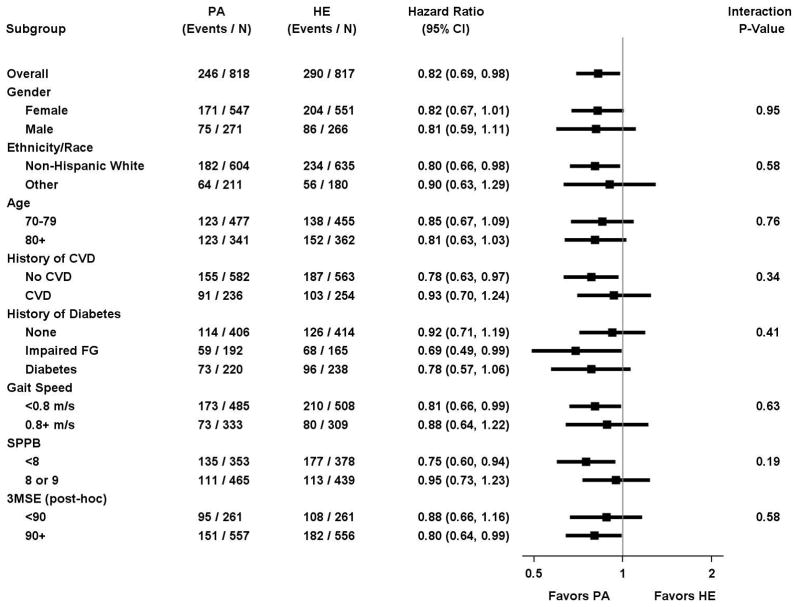
Figure 4.
Forest plot of the hazard ratio of major mobility disability for physical activity vs. health education according to sub-groups (PA= Physical Activity; HA = Health education; FG = Fasting Glucose). P-values were obtained from likelihood ratios tests of the interaction terms added to the Cox regression model.

