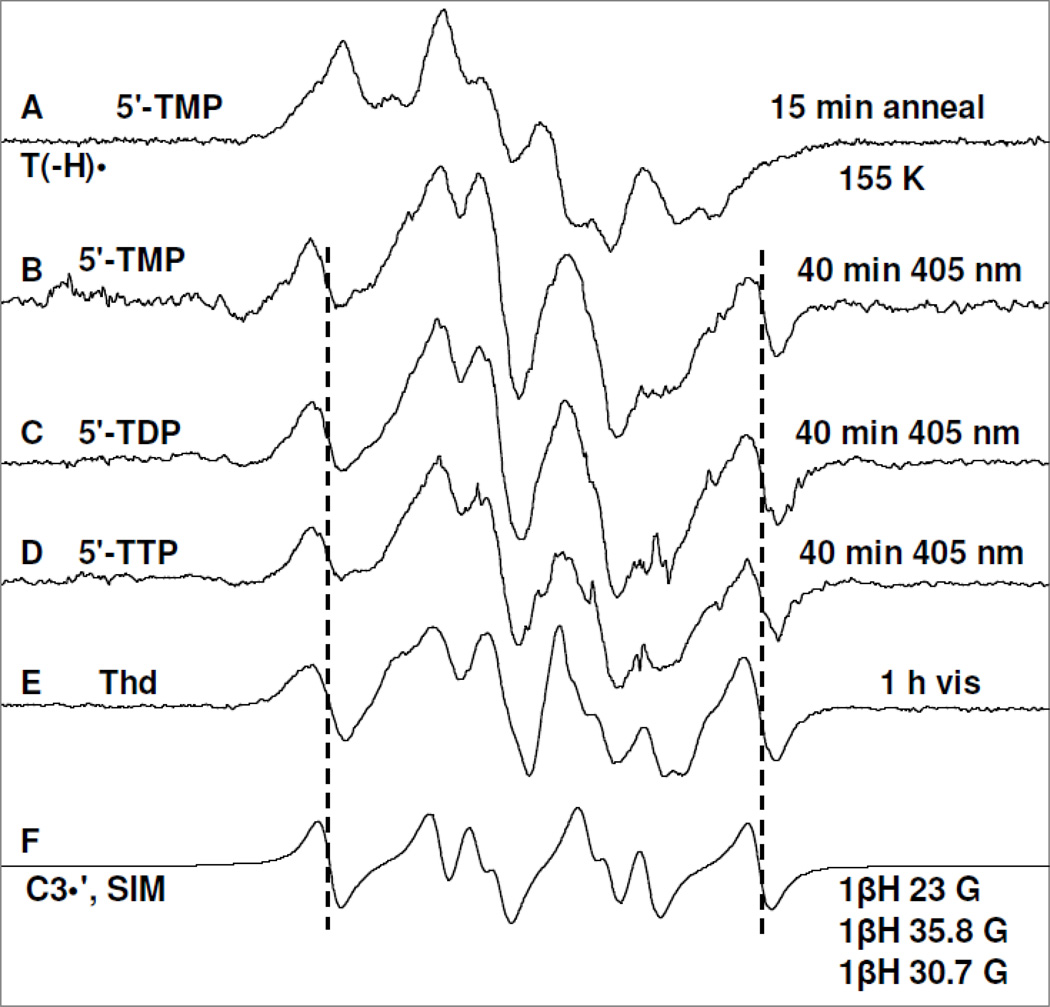
Figure 3.
Spectrum (A) of T(−H)• produced via annealing at 155 K owing to one-electron oxidation of the N3-deprotonated thymine base in 5′-TMP (3 mg/ml) by Cl2•− in homogeneous aqueous glass (7.5 M LiCl/D2O) at pD ca. 10 in the presence of excess K2S2O8 ; (B) after photoexcitation of T(−H)• in 5′-TMP shown in (A) using 405 nm laser at 143 K for 40 min; (C) after photoexcitation of T(−H)• in a matched sample of 5′-TDP (3 mg/ml) using 405 nm laser at 143 K for 40 min; (D) after photoexcitation of T(−H)• -of T(−H)• in a matched sample of 5′-TTP (3 mg/ml) using 405 nm laser at 143 K for 40 min; (E) after visible illumination of T(−H)• formed in a similarly prepared sample of Thd (3 mg/ml) at pD ca. 11 at 143 K. (F) The simulated C3′• spectrum has been obtained using three isotropic β-proton HFCC (text). The line components of the C3′• spectrum is visible in spectra (B) to (E) as indicated by the dotted lines. Similar to the results found in Figure 2 and reaction (5), a small extent of Cl2•− (ca. 10%) formed via one-electron oxidation of the matrix (LiCl) by (T(−H)•)* has been subtracted from each of the experimentally recorded spectra and the subtracted spectra have been presented in Figures 3(B) to 3(E).

