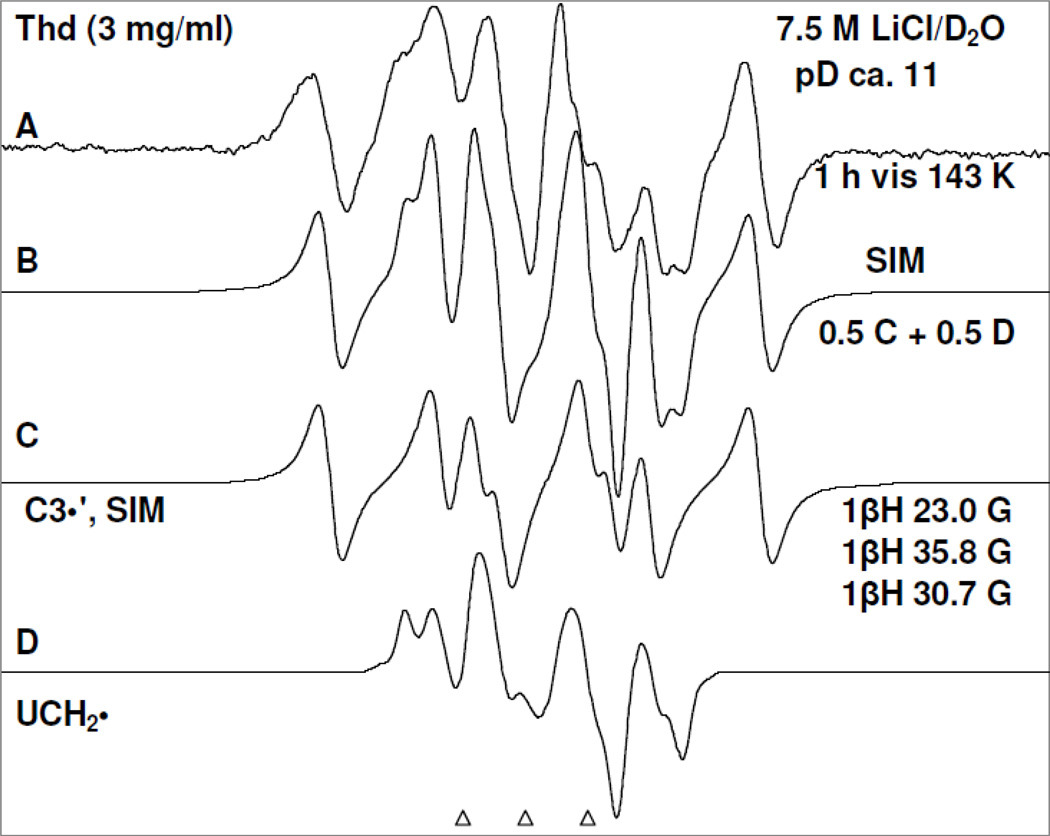
Figure 4.
Spectrum (A) after visible illumination by photoflood lamp of T(−H)• formed in a sample of Thd (3 mg/ml) at pD ca. 11 at 143 K for 1 h. This spectrum is already shown in Figure 3 (E). Spectrum (B) obtained after adding 50% of spectrum (C) due to C3′• (see spectrum 3(F)) and 50% of spectrum (D) due to UCH2• as benchmarks.

