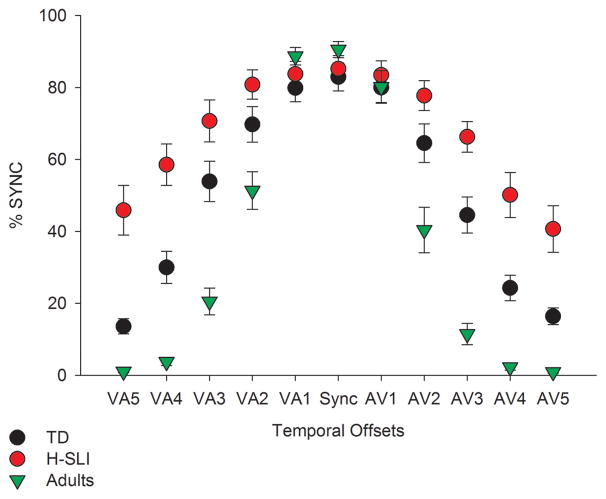
Figure 2. Performance on the simultaneity judgment task.
The x axis displays all temporal offsets used in the study, with visual-auditory (VA) offsets in the left part of the graph and the audio-visual (AV) offsets in the right part of the graph. Numbers 1 through 5 correspond to temporal offsets of 100 ms to 500 ms, in 100 ms increments. For example, AV3 identifies a temporal offset in which the sound preceded the light by 300 ms. The y axis shows percent of synchronous perceptions. As offsets increased, percent of synchronous perceptions was expected to decrease. Error bars are standard errors of the mean.

