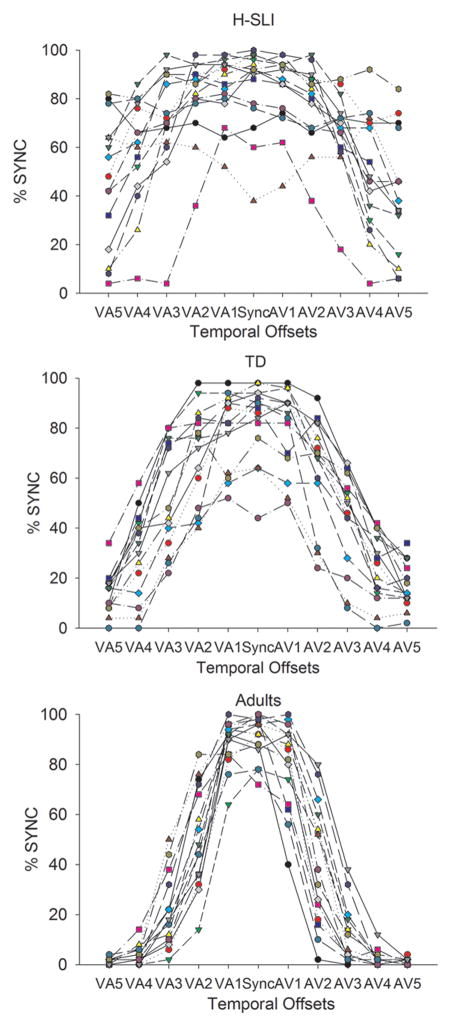
Figure 3. Individual differences in performance on the simultaneity judgment task.
The x axis displays all temporal offsets used in the study, with VA offsets in the left part of the graph and the AV offsets in the right part of the graph. Numbers 1 through 5 correspond to temporal offsets of 100 to 500 ms, in 100 ms increments. For example, AV3 identifies a temporal offset in which the sound preceded the light by 300 ms. The y axis shows percent of synchronous perceptions. Each line represents a separate participant.

