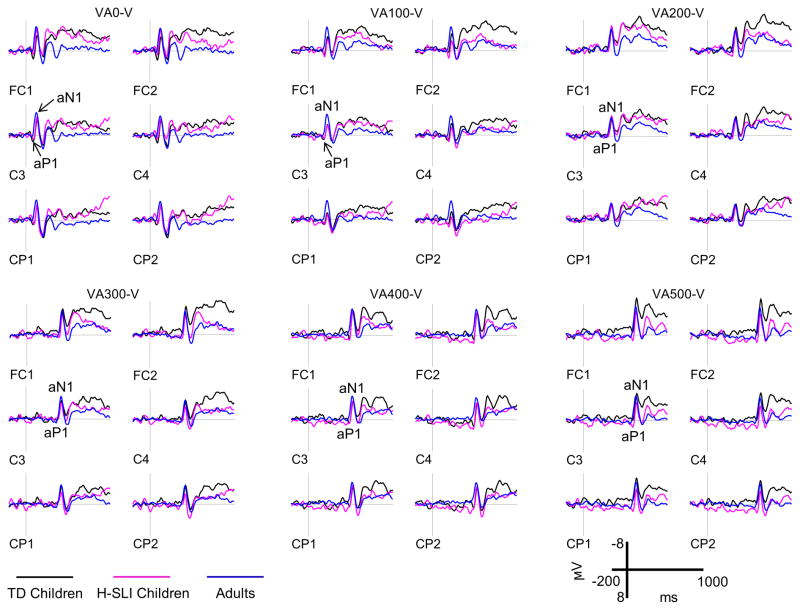
Figure 8. Auditory ERPs.
Auditory ERPs elicited by the 2 kHz pure tone are shown for the H-SLI, TD, and adult groups over a representative set of electrodes. All ERPs are difference waves that were created by subtracting visual only trials from VA stimuli with different offsets in order to reveal brain activity specific to auditory stimulation. Difference waves are labeled based on the subtraction that was used to create them. For example, the VA500-V panel shows auditory ERPs that were revealed by subtracting visual only trials from ERPs elicited by visual-auditory stimuli with a 500 ms offset. Measured components are marked on the C3 site. Negative is plotted up.

