
Figure 2.
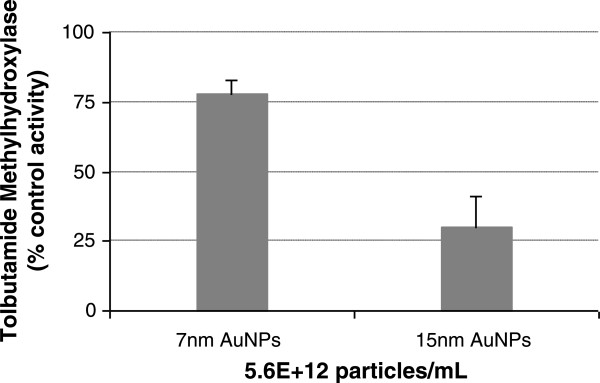
AuNP-induced disruption of CYP2C9 activity with different particle size (7-nm and 15-nm) at the same particle concentration. Data are mean values ± SD (n = 3) and are expressed as a percentage of the CYP activity without AuNPs.
Official websites use .gov
A
.gov website belongs to an official
government organization in the United States.
Secure .gov websites use HTTPS
A lock (
) or https:// means you've safely
connected to the .gov website. Share sensitive
information only on official, secure websites.
AuNP-induced disruption of CYP2C9 activity with different particle size (7-nm and 15-nm) at the same particle concentration. Data are mean values ± SD (n = 3) and are expressed as a percentage of the CYP activity without AuNPs.