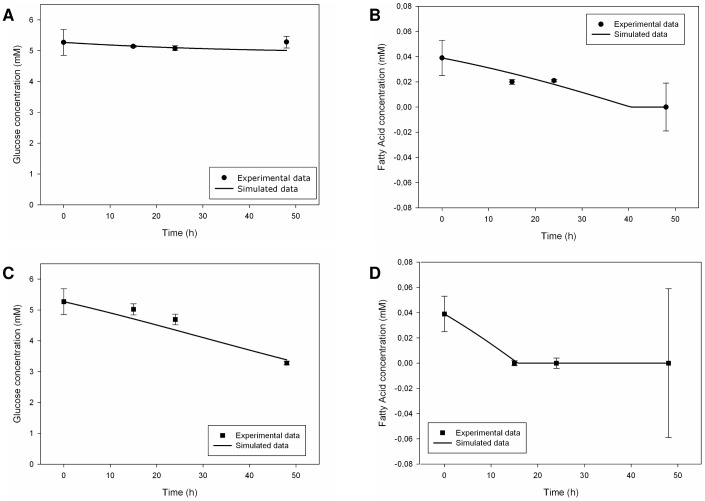
Figure 6. Measured [23] and simulated glucose and fatty acid trends in the culture medium for hepatic monocultures.
Upper figures refer to static conditions, the other ones describe dynamic conditions. Solid lines represent the simulated data, while circles (for the static case) and squares (for the dynamic case) represent the corresponding experimental data. Measured values are expressed as means ± standard deviation for experiments run at least in triplicate: numerical values are reported in [23] and error bars represent the standard deviation. (A) Glucose trend in static conditions. (B) Fatty acid trend in static conditions. (C) Glucose trend in dynamic conditions. (D) Fatty acid trend in dynamic conditions.

