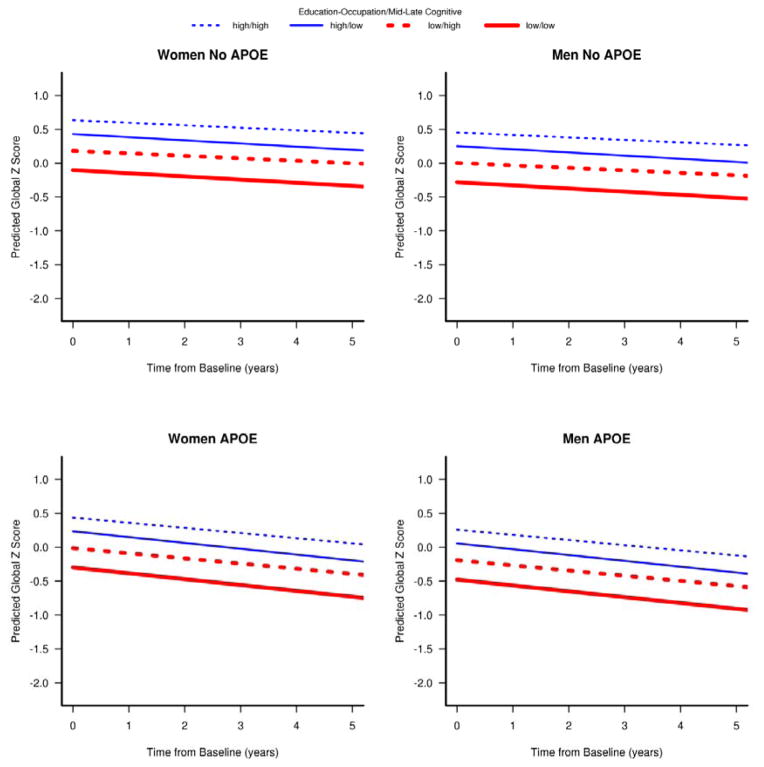
Figure 1.
Predicted cognitive global z-scores as a function of time from baseline for different levels of intellectual enrichment measures. The graphs illustrate the interaction between education/occupation-score and mid/late-life cognitive activity. In the figure, low and high intellectual enrichment were defined by 25th and 75th percentiles. The red lines indicate low and blue indicate high education/occupation-scores. The solid lines indicate low mid/late-life leisure activity and dashed lines indicate high mid/late-life cognitive activity.

