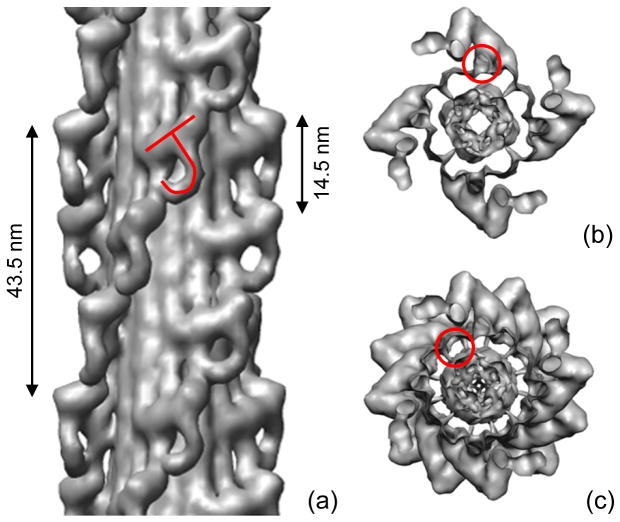
Figure 3. Three-dimensional reconstruction of Limulus thick filament.
(a) Pairs of myosin heads, represented by tilted “J” motif, run in four parallel helices, with a repeat of 43.5 nm and an axial spacing between 4-fold rotationally symmetric ‘crowns’ of heads of 14.5 nm. (b) Transverse view of one 14.5 nm level of myosin heads, showing 4-fold rotational symmetric arrangement, viewed from bare zone. S2 is outlined. (c) Transverse view of one complete repeat (43.5 nm) of heads. In (b) and (c), four groups of three subfilaments appear as hollow tubes due to surface rendering (one has been outlined in (c)). The subfilaments in fact represent the highest density region of the map (Fig. 5a). In contrast, the center of the filament (interior to the tubes) appears solid but is in fact of low density (Fig. 5a).

