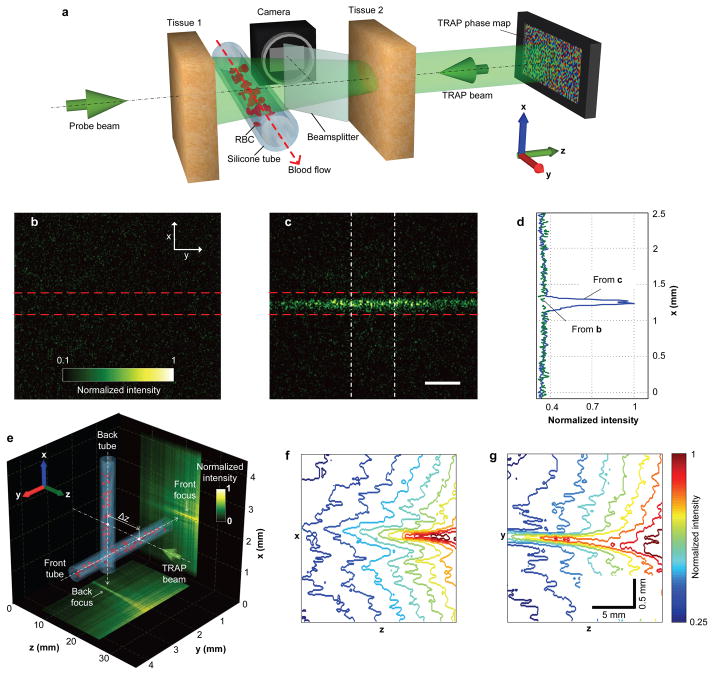
Figure 3. Focusing light onto flowing targets inside biological tissue.
a, Experimental configuration. Light is focused onto the tube through tissue 2. The focal intensity is monitored by a CMOS camera. b, c, Focal light intensity distribution due to an incorrect (b, phase map shifted by 3 pixels) and a correct (c) phase map. Dashed lines highlight the tube boundaries. d, Intensity distributions across the tube obtained by integrating horizontally within the region enclosed by the dashed-dot lines in c. The baseline is obtained by applying the same integration procedure to b. e, Two vessels are arranged perpendicularly to each other, separated by Δz = 1 cm in the axial (z) direction. The measured light distribution is projected along the x and y directions to the bottom and right surfaces of the cube, respectively. f, g, Intensity contours of the front (f) and back (g) foci. Scale bar in c, 500 μm.

