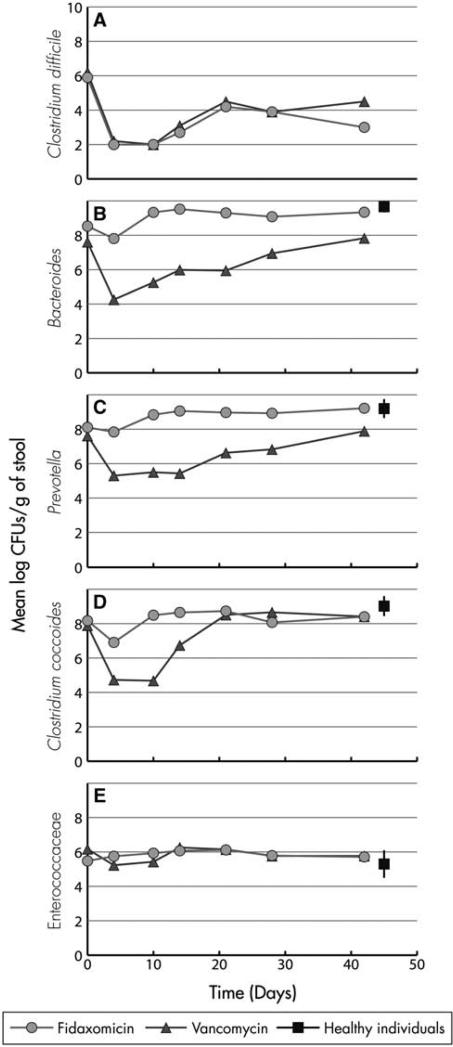
Figure 3.
Example graphs from student case-study sheets. Students use these graphs to interpret fluctuations in microbial populations in response to antibiotic treatment of patients with C. difficile infection. (Graphs recreated from published data in Louie et al., 2012.)

