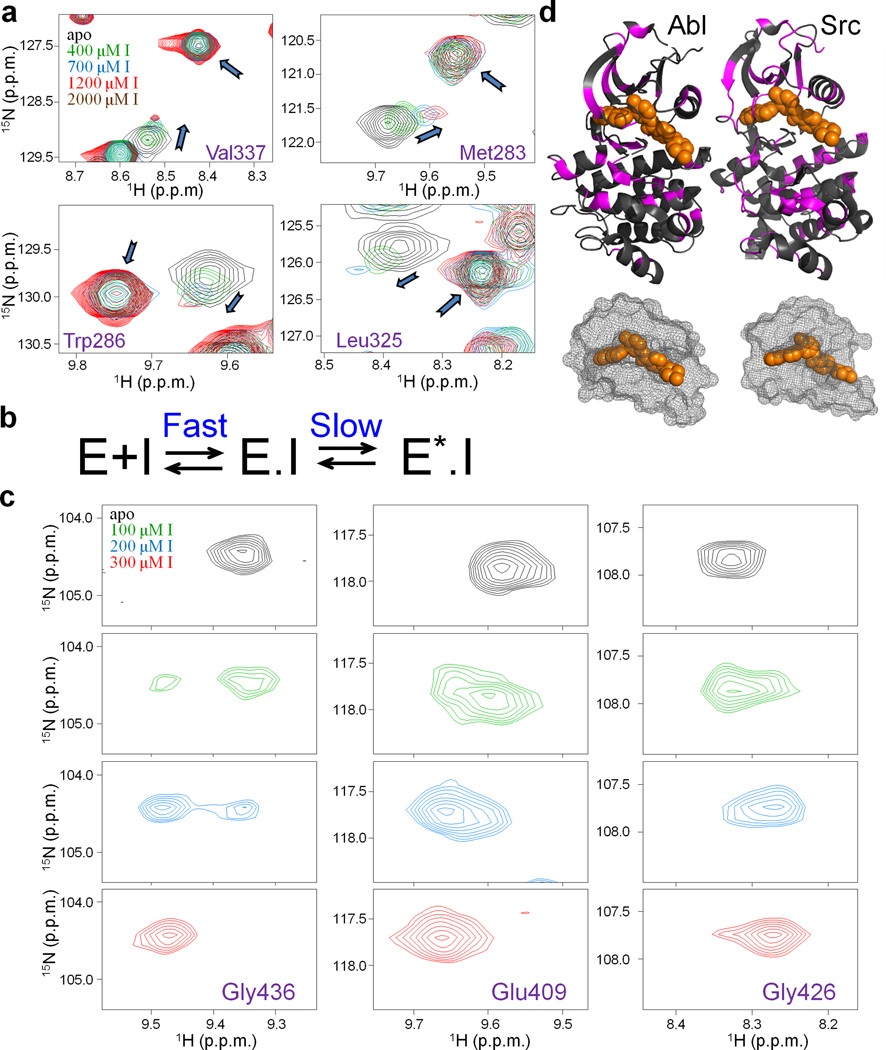
Figure 1.
Monitoring the Gleevec binding process to Src and Abl by NMR at 25 °C. (a) Zoom of [1H, 15N]-HSQC spectra showing an unusual pattern of chemical shifts perturbations (shifting of free peak position coinciding with the reappearance of Gleevec-bound peak) upon the titration of Src with Gleevec. (b) Biochemical scheme that can explain the observed titration patterns27 (see also Supplementary Fig. 1). E and E.I correspond to free and inhibitor bound kinase, E*.I corresponds to inhibitor bound kinase in a distinct conformational state. (c) Abl titration shows a simpler pattern with disappearance and reappearance of the peaks indicative of tight binding. (d) Residues with chemical shift changes upon Gleevec binding are plotted onto the crystal structures (pdb ids: 1OPJ, 2OIQ16,31) in magenta, Gleevec is shown in orange. The mesh representation of the Gleevec binding pocket illustrates how part of the drug is covered by the protein suggesting a conformational change after binding (step 2 in Fig. 1b).

