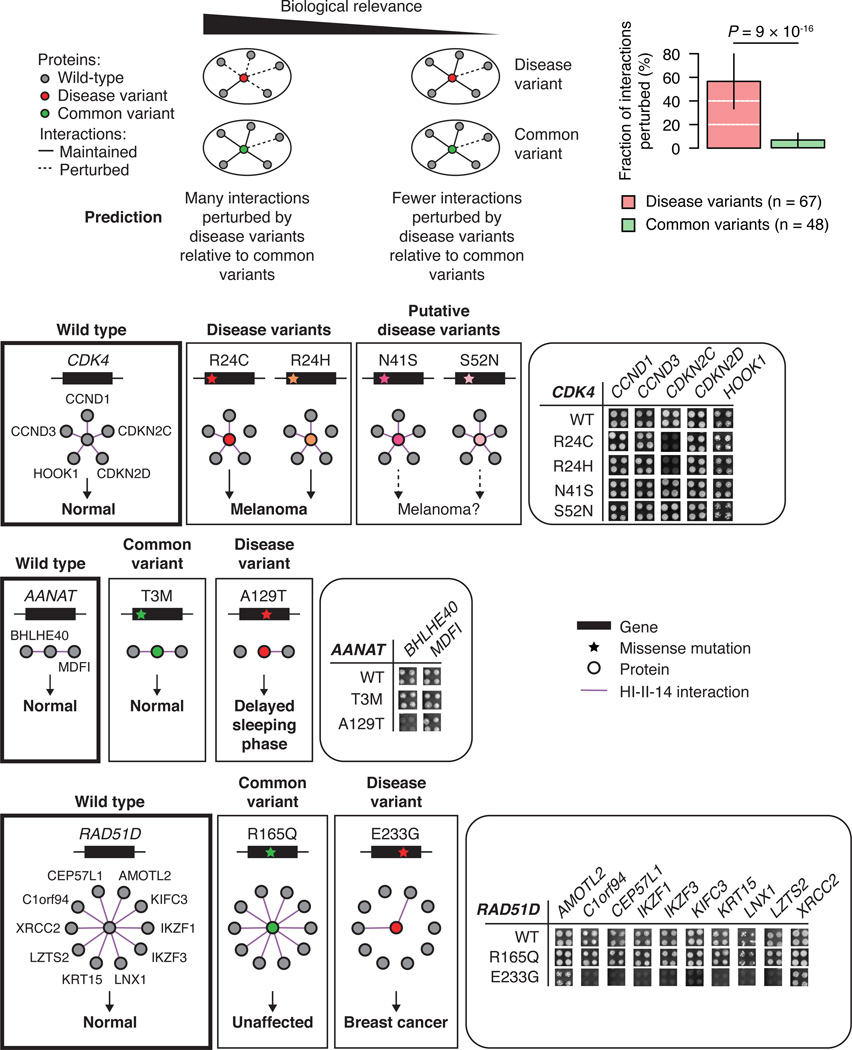
Figure 3. Perturbations of protein interactions by disease and common variants.
Fraction of interactions of the wild-type gene product lost by mutants bearing the disease-associated or common variants (top right, error bars indicate standard error of the proportion). P value, two-sided Fisher’s exact test. Comparison of interaction profile of wild-type CDK4, AANAT, and RAD51D to the interaction profiles of mutant bearing disease or common variants (bottom). Yeast growth phenotypes on SC-Leu-Trp-His+3AT media in quadruplicate experiments are shown.

