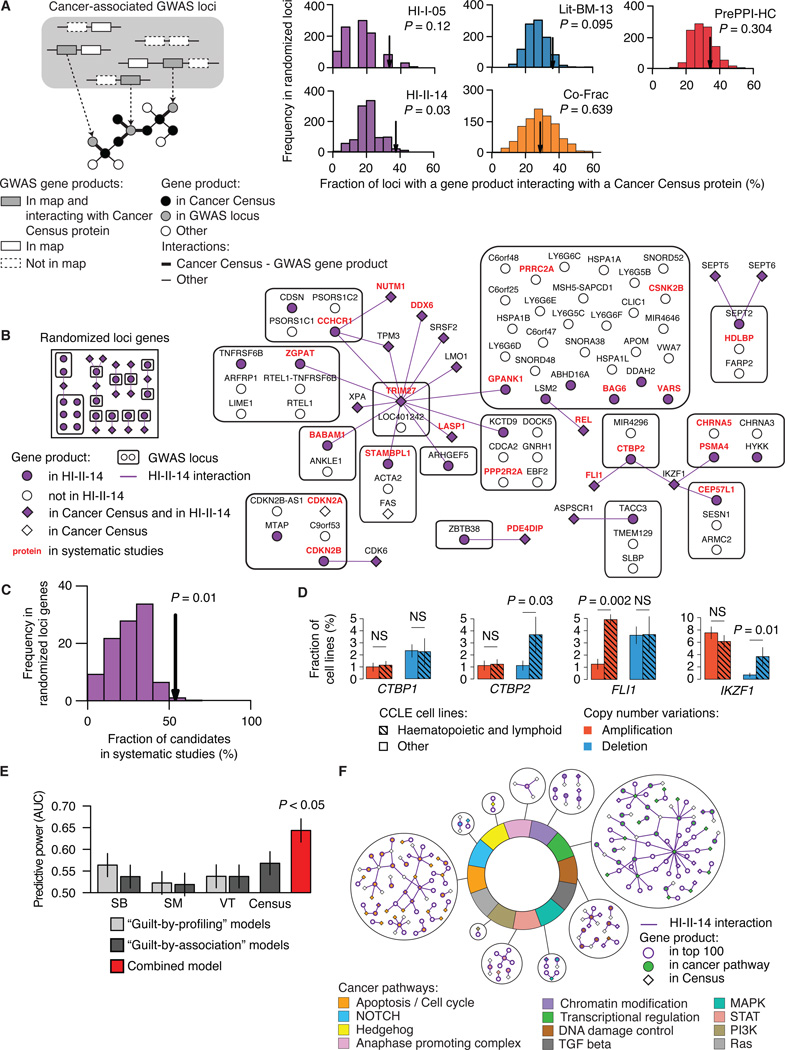
Figure 7. Interactome network and cancer landscape.
(A) Fraction of cancer-related GWAS loci containing at least one gene encoding a protein that interacts with the product of a Cancer Census gene in HI-I-05, HI-II-14, Lit-BM-13, Co-Frac and PrePPI-HC (arrows) as compared to randomly selected loci genes. GWAS loci already containing a Cancer Census gene are excluded. Empirical P values. For n values, see Table S6.
(B) Network representing products of genes in cancer-associated GWAS loci and their interactions with Cancer Census proteins in HI-II-14 (right), and a representative example of the network obtained for randomized loci genes (left).
(C) Fraction of GWAS loci gene products interacting with a Cancer Census protein also identified in systematic genomic and functional genomic studies (arrow) as compared to the fraction obtained for randomized loci genes (bottom right). Empirical P value.
(D) CTBP2 and IKZF1 are deleted in significantly more haematopoietic and lymphoid cancer cell lines than in other cancer cell lines. CCLE, Cancer Cell Line Encyclopedia. Each barplot compares the fraction of cell lines from the 163 haematopoietic and lymphoid (hatched bars) or 717 other (empty bars) cell types where CTBP1, CTBP2, FLI1 or IKZF1 were found amplified (red) or deleted (blue). P values, two-sided Fisher’s exact tests (NS for P > 0.05).
(E) Predictive power of guilt-by-profiling and guilt-by-association models compared to the combined model (Figure S6; see Extended Experimental Procedures, Section 11). AUC: Area under the curve in Figure S6C. P value, two-sided Wilcoxon rank sum test. SB, Sleeping Beauty transposon-based mouse cancer screen; SM, Somatic mutation screen in cancer tissues; VT, Virus targets.
(F) Binary interactions from HI-II-14 involving the top candidates and Cancer Census gene products in the twelve pathways associated to cancer development and progression. See also Figures S5, S6 and S7 and Table S5.

