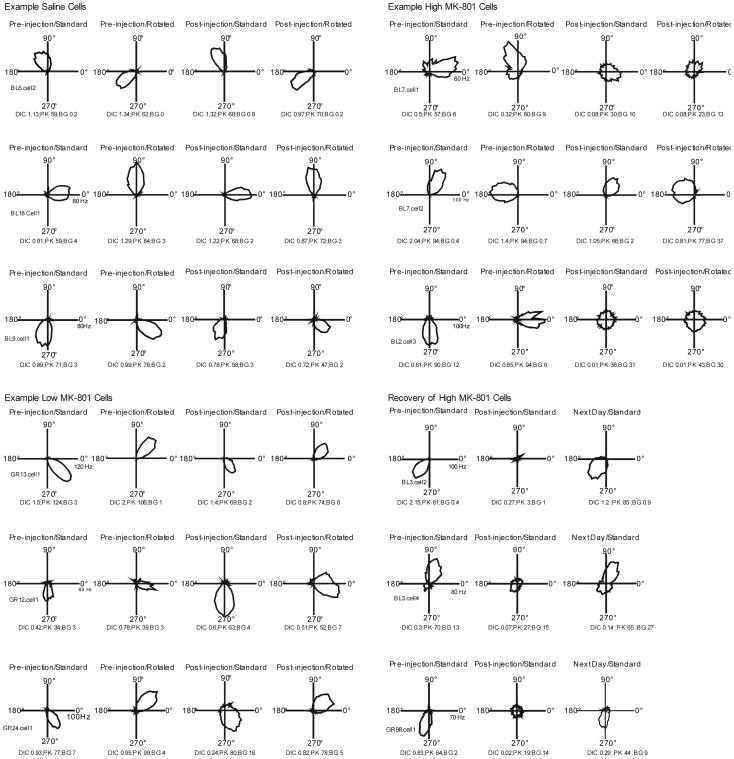
Figure 3.
FR by HD tuning curves in the form of polar plots for three example cells from each condition. The bottom right panel shows the typical recovery of drug induced attenuation of directional specificity observed during recordings performed the next day. Cells were selected for display based on the amount of Post-Injection attenuation of the DIC measure shown in the session, with the first cell in each condition showing the typical DIC attenuation of that condition, the second cell showing the magnitude of attenuation typical of the lowest quartile of cells, and the third cell showing an effect typical of the largest quartile in the condition. The values shown at the bottom of each panel indicate DIC, Peak FR, and Background FR for that session.

