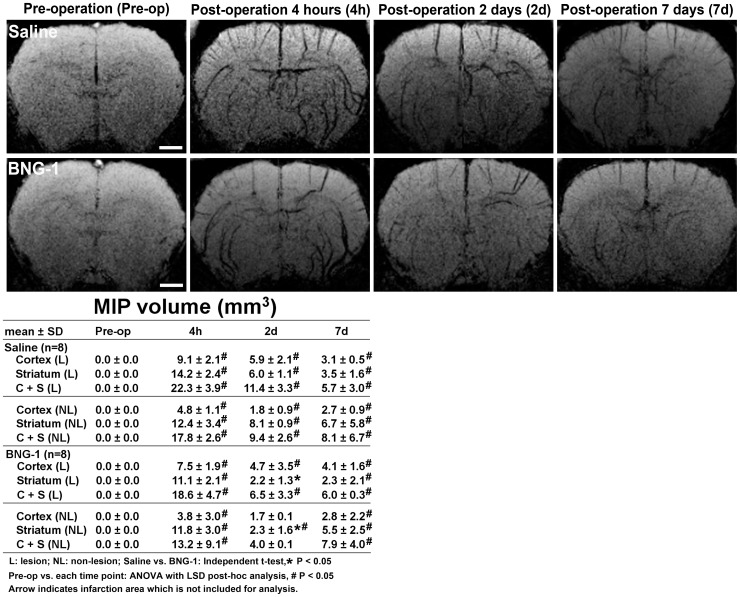
Figure 4. Comparison of the temporal changes in the maximal intensity projection after focal cerebral ischemia between the saline and BNG-1 treatments.
The maximal intensity projection of the SWI indicates that the volume of the low signal intensity (cerebral vessels) is smaller in the BNG-1 group than the saline group in the striatum of both lesion and non-lesion hemispheres at 2 d. The bar in the pre-operation panels indicates 2.5 mm.

