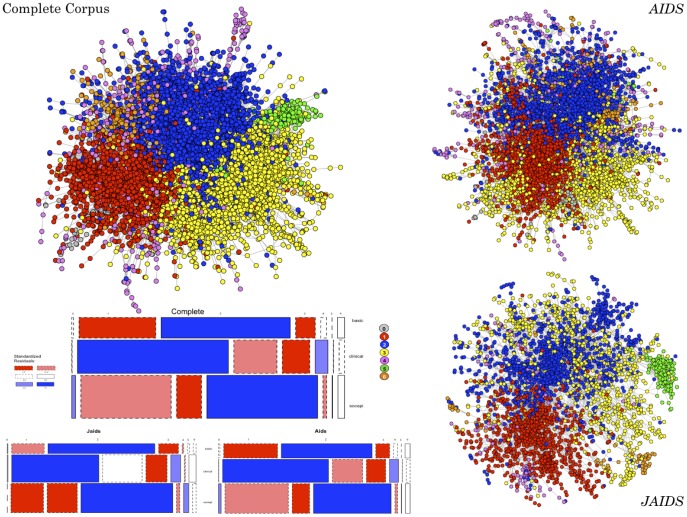
Figure 1. Bibliographic Coupling Network Communities in the Complete Corpus.
Panel A presents the full bibliographic coupling network, edge-reduction is based on papers with weighted similarity scores two standard deviations above the median similarity among non-isolates in the network. Node color represents each paper's identified bibliographic coupling community using the Newman-Girvan algorithm [26]. Panels B and C present the same analyses limited only to publications from AIDS and JAIDS respectively. Panel D show the correspondence between communities and the broad “discipline” like labels applied to all published articles beginning in 1998. Color represents whether a label is over (blue) or under (red) represented in a given community according permutation-based residuals.

