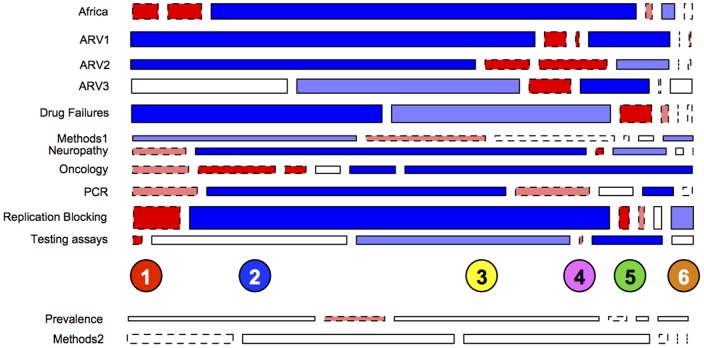
Figure 2. Community-Topic (lack of) Correspondence.
This mosaic plot shows those topics that are overrepresented present in more than one network community (top 11), or are not consolidated in any community (bottom 2). The topics are derived via LDA (see Supplementary Information) and the communities are those represented in Fig. 1. Color represents over (blue) and under (red) representation of a topic in a given community according to permutation-based residuals.

