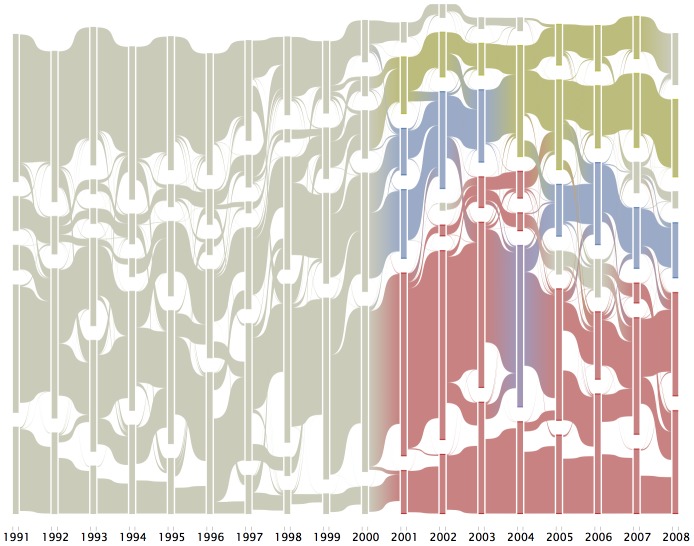
Figure 4. Alluvial Flow Diagram w/“Discipline” Like Labels.
This figure presents the evolution of clusters within 5-year moving windows (reduced to include only clusters containing at least 50 papers). The color corresponds to clusters in which the broad “discipline”-like labels are over-represented in a given community (yellow = Social/Epidemiological, blue = Basic, red = Clinical).

