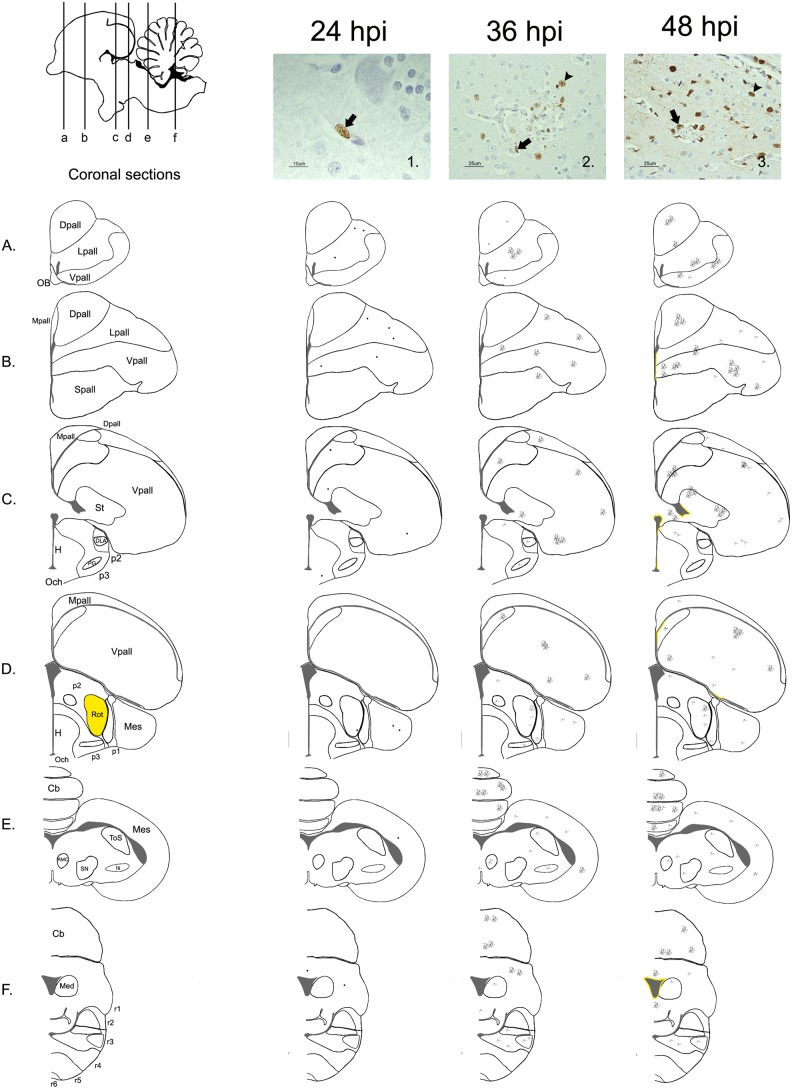
Figure 7. Distribution of the HPAI H7N1 antigen detected by immunohistochemistry in formalin fixed chicken’s brain samples.
Schematic sagittal drawings of the chicken’s brain showing the distribution of the IAV antigen at 24, 36 and 48 hpi, according to the coronal levels represented in the diagrams below (A, B, C, D, E, F). In this study, the intensity of the staining was always scarce; consequently, in the diagram corresponding to 24 hpi, a dot was drawn in those regions where a positive cell was found. Microphotography 1. shows an endothelial cell (black arrow) with positive viral antigen staining in the nucleus (10 µm). At 36 and 48 hpi, the intensity of influenza virus antigen staining was slight, varying the number of cell from 2 to 80 positive cells per foci. Bilateral staining was only found in the Rot (thalamus- p2) at these hours (labelled in yellow in the diagram of the left). Microphotography 2. shows a neuron surrounded by several positive glial cells (arrowhead) beside a disrupted capillary (black arrow) at 36 hpi, located in the Rot (p2) (25 µm). Positive viral antigen was detected in few ependymal cells until 48 hpi. Microphotography 3. shows the presence of viral antigen in endothelial cells (black arrow), glial cells (arrowhead), neurons, and ependymal cells (white arrow) (25 µm).

