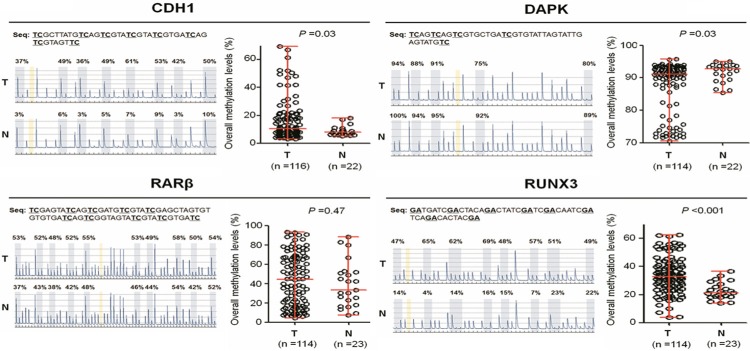
Figure 1.

Analysis of overall methylation levels of four tumor suppressor genes in PTC samples using pyrosequencing assay. Pyrosequencing method was performed as described in Methods. Representative pyrograms show methylation levels of the indicated CpG sites in gene promoter (left panel). The average methylation level of each gene is represented in the right panel. Horizontal lines represent the median and the 25th to 75th percentile. T, PTC tissues; N, goiter tissues. P values < 0.05 were considered significant.
