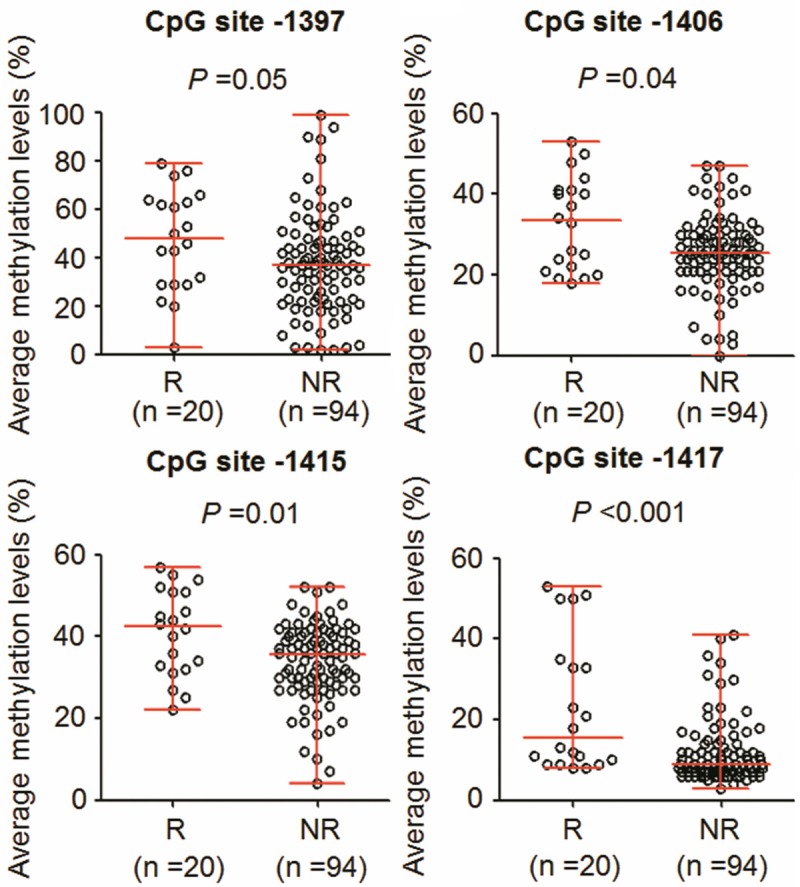
Figure 4.

Association of RUNX3 site-specific methylation levels with tumor recurrence. Shown were scatterplots of RUNX3 site-specific methylation levels in recurrent (R) and non-recurrent (NR) cases. Horizontal lines represent the median and the 25th to 75th percentile. P values < 0.05 were considered significant.
