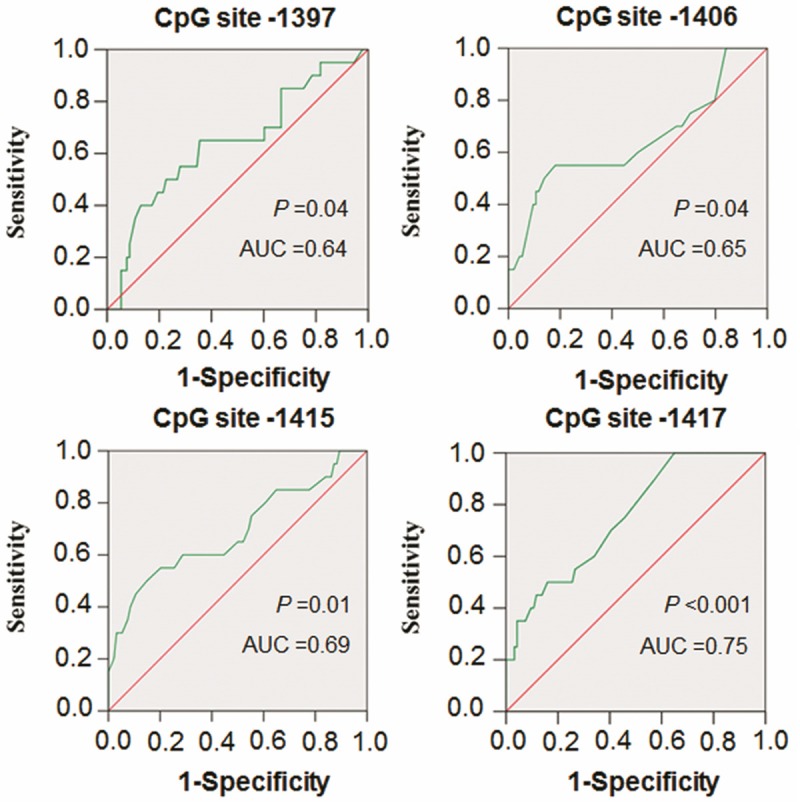
Figure 5.

Receiver operating characteristic (ROC) curves for four CpG sites in the RUNX3 promoter. All recurrent and non-recurrent PTCs for which there was complete DNA methylation data were used for the analysis. The ROC curves plot sensitivity and 1-specificity. Areas under the curve (AUC) and P values were shown in the graph.
