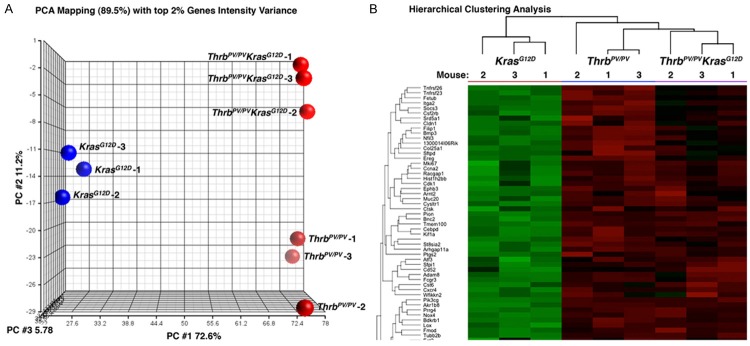
Figure 1.

Principal component analysis (PCA) and heat-map of hierarchical clustering analysis of the top 2% of genes selected by variance in gene expression of follicular cells of KrasG12D mice and thyroid tumor cells of ThrbPV/PV and ThrbPV/PV KrasG12D mice. A. Three-dimensional projection of the top 3 principal components of PCA in the figure, which captures 89.5% of total variance, shows clear separation of the 3 mouse groups. B. A heat-map (cropped) presentation of hierarchical clustering analysis (average of Euclidean distance) of the top 2% of genes selected by variance in gene expression of the 3 groups of mice. The clustering in the figure shows the 3 groups of mice form 3 clusters, but at the top level, the KrasG12D mice remain 1 cluster and the ThrbPV/PV and ThrbPV/PV KrasG12D mice form another cluster, which indicates the ThrbPV/PV mice might closer to ThrbPV/PV KrasG12D mice in the gene expression profiling.
