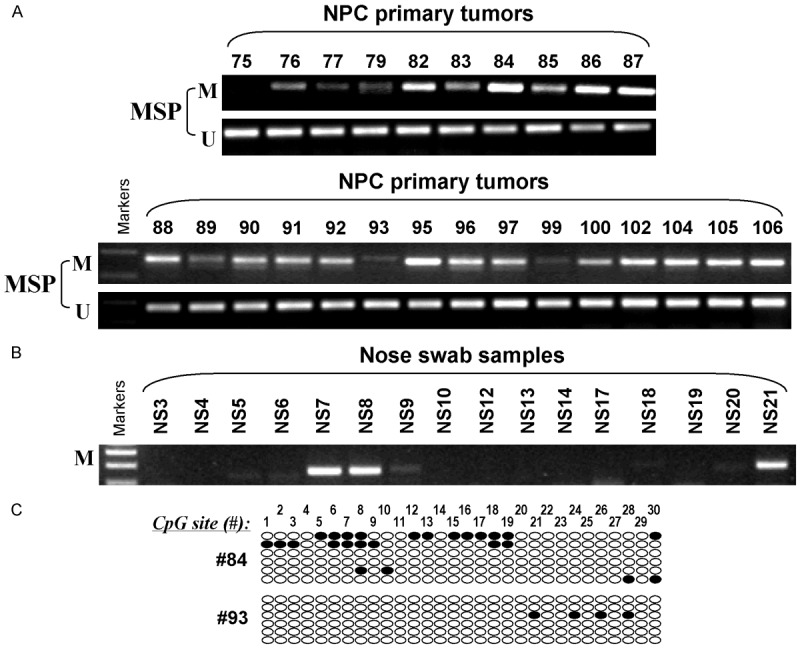
Figure 3.

LOX promoter methylation analysis in NPC. Representative MSP results of (A) NPC primary tumors and (B) nose swab samples. (C) High-resolution methylation analysis of the LOX promoter in 2 NPC primary tumors. Each row indicates a promoter allele analyzed and each circle corresponds to a single CpG site. Dark circles (●) and empty circles (○) represent methylated and unmethylated CpG sites respectively.
