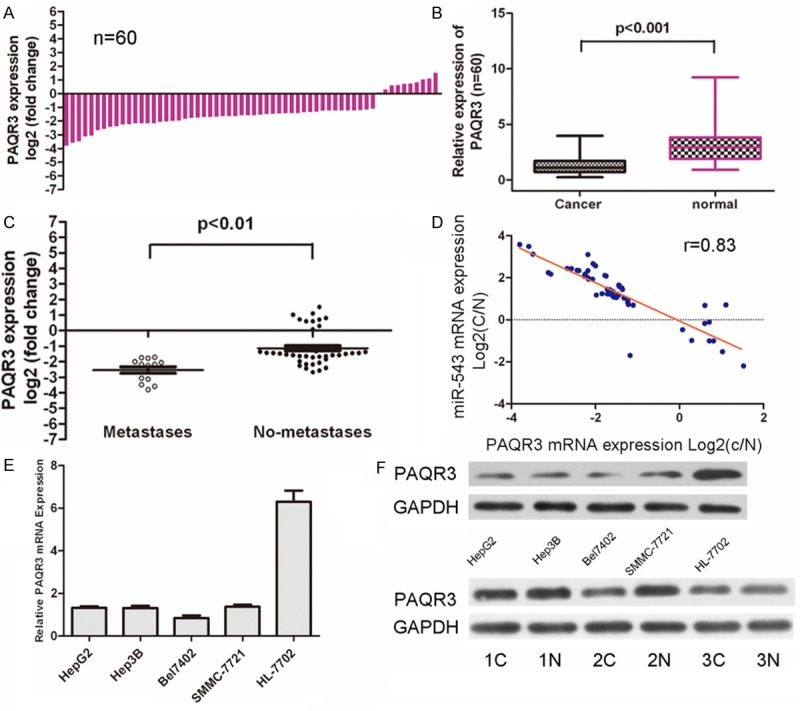
Figure 4.

MiR‑543 expression inversely correlated with PAQR3 mRNA in HCC samples. A. qRT-PCR analysis of PAQR3 expression in 60 pairs HCC tissues and their corresponding adjacent nontumorous livers. The expression of PAQR3 was normalized to GAPDH mRNA. B. Relative PAQR3 expression levels in HCC tissues and adjacent normal regions; C. Statistical analysis of the association between PAQR3 level, pM stage (No metastasis and Metastasis, respectively). D. The mRNA expression of PAQR3 was inversed correlation the expression of miR-543 levels in patient samples. E. qRT-PCR analysis of PAQR3 expression in HCC cells (HepG2, Hep3B, Bel7402, SMMC-7721) and normal hepatopcytes (HL-7792 cells). F. Western blot analysis of PAQR3 expression in the HCC cells (HepG2, Hep3B, Bel7402, SMMC-7721) and normal hepatopcytes (HL-7792 cells); and 3 pairs NSCLC tissues and their corresponding adjacent normal lung tissues.
