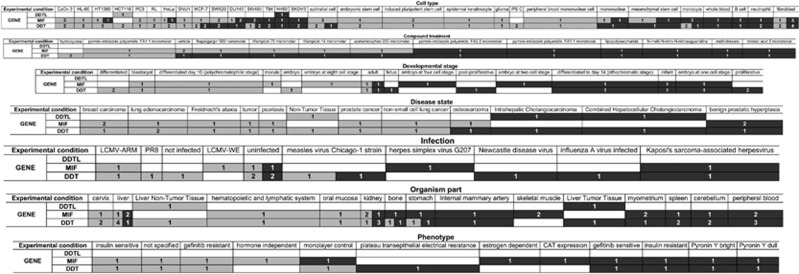
Figure 4.
Heatmap of expression analysis of MIF-related genes obtained from the Gene Expression Atlas database. In each cell, the number of studies is reported. Overexpression is represented by light grey, and the underexpression is represented by dark grey. Cells split with light and dark grey represent experimental conditions with conflicting data.

