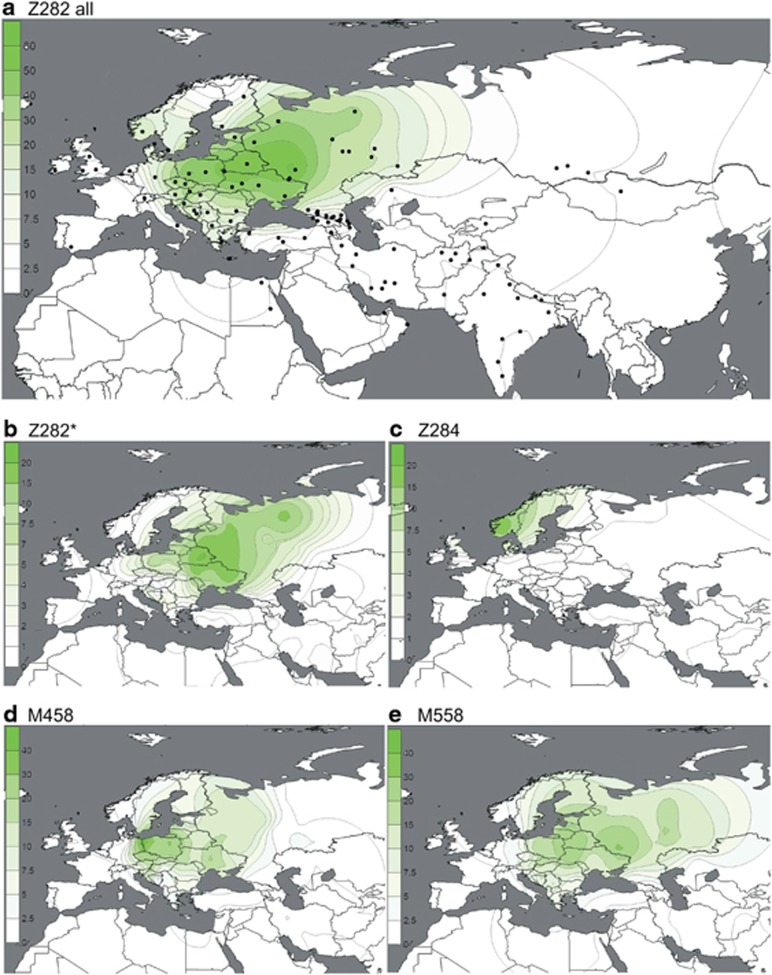
Figure 2.
(a–e) Spatial frequency distributions of Z282 affiliated haplogroups. Each map was generated using the frequencies from Supplementary Table 4 among 14 461 individuals, distributed across 119 population samples (references listed in Supplementary Table 4). Because of the known difference between the origin and present distribution of the Roma and Jewish populations, they were excluded from the plots. Additional populations from literature27 were used for the M458 map.

