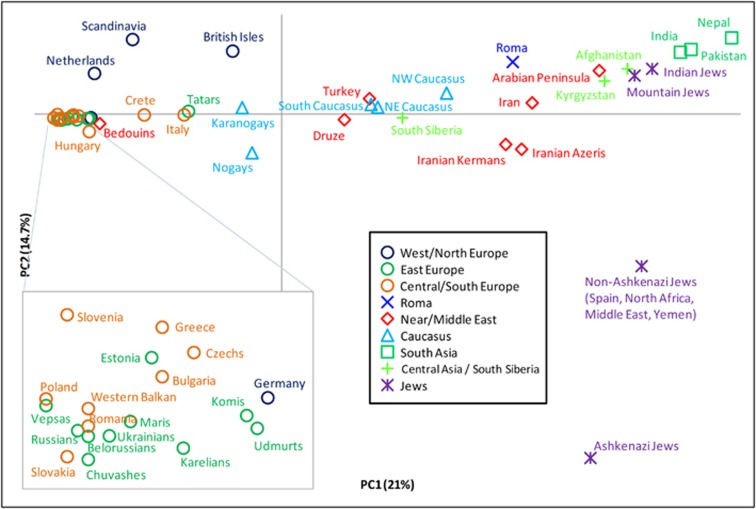
Figure 4.
Principal component analysis of hg R1a subclades. The plot was obtained by collapsing the 126 populations into 49 regionally/culturally defined groups and calculating R1a subclade frequencies relative to R1a-M198. We excluded one population with small overall sample size and all populations in which fewer than 5 R1a Y-chromosomes were observed.

