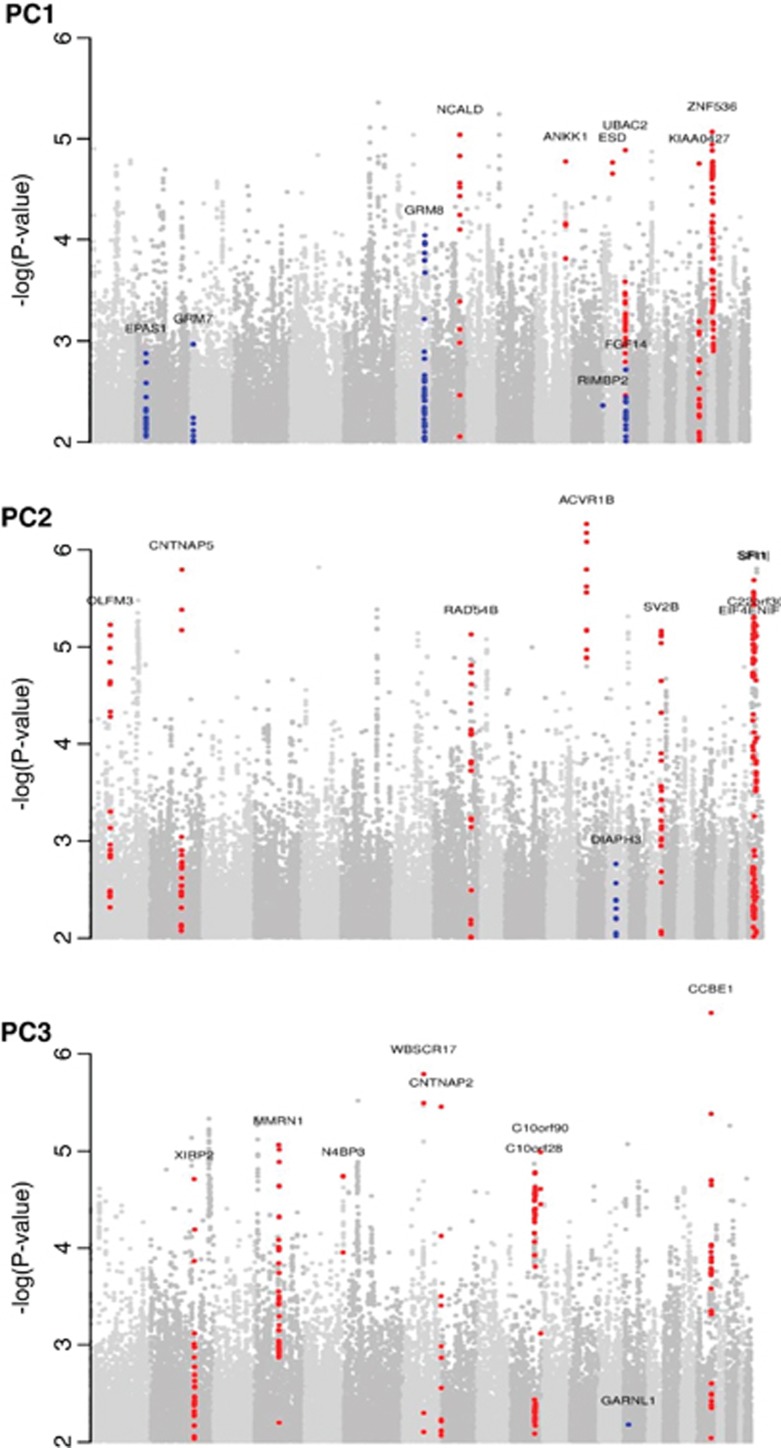
Figure 2.
Manhattan plot for the common variant analysis. The figure shows the logarithm of the P-values for the association of the genotypes versus each of the three PC phenotypes. P-values above 0.01 are not shown. Red dots indicate the SNPs in the genes that show the strongest association in the current study. Blue dots highlight the genes with a previously reported association with ARHI by Girotto et al,5 plus the GRM7 gene reported by Friedman et al3 and the IQGAP2 gene reported by Van Laer et al.4

