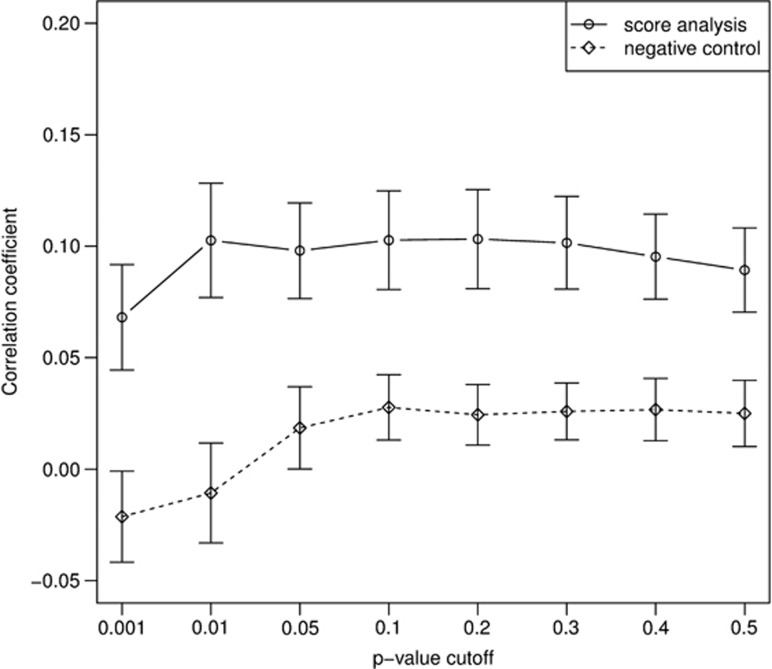
Figure 3.
Score analysis. Pearson correlation coefficients between the observed phenotype (PC1) and the predicted phenotype from the individuals in the validation set are shown in black. Correlation coefficients between these predicted phenotypes and an independent phenotype (PC2), which served as a negative control, are shown in red. Error bars denote the standard errors obtained by 10-fold cross-validation.

