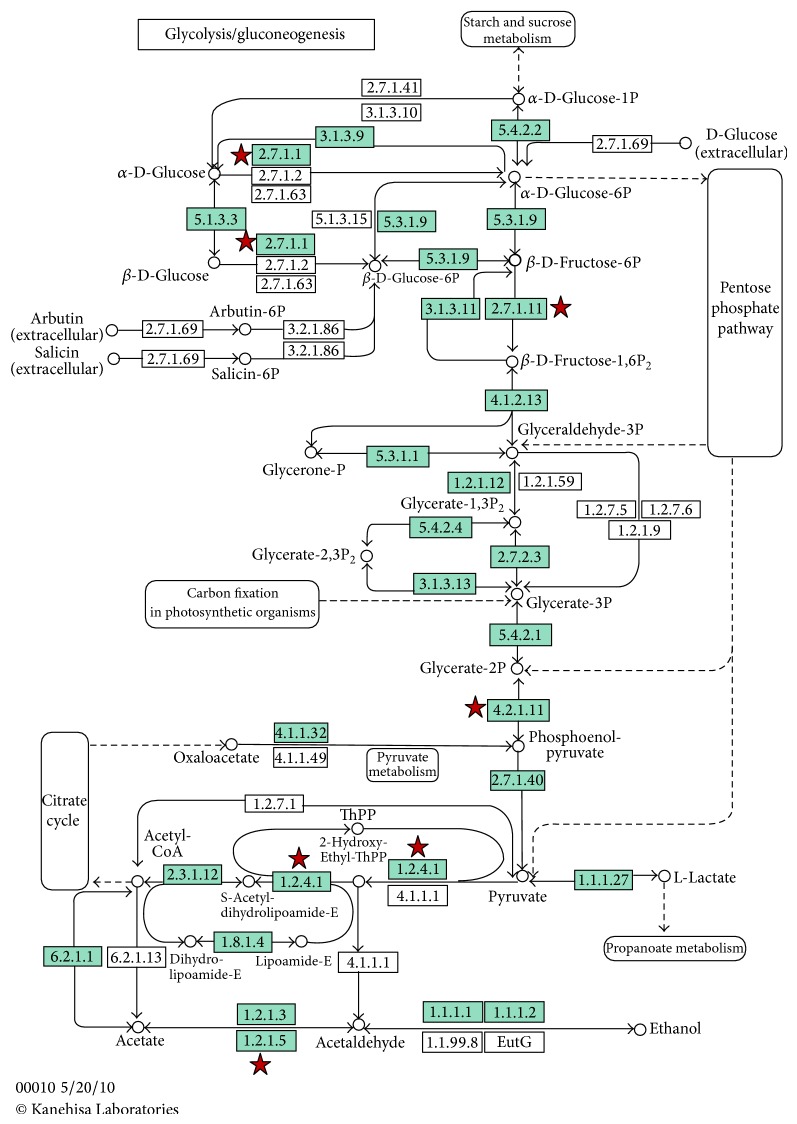
Figure 2.
Pathway information of glycolysis/gluconeogenesis. Green boxes denote signaling pathway protein. Red stars mark the genes of differential expression including upregulated and downregulated genes: box 2.7.1.1 for hexokinase-1 and hexokinase-2, box 2.7.1.11 for phosphofructokinase (muscle a), box 4.2.1.11 for enolase-3 (beta, muscle), box 1.2.4.1 for pyruvate dehydrogenase (lipoamide) alpha-1a, and box 1.2.1.5 for aldehyde dehydrogenase-3 family (member D1). Figure 2 was formed from all differentially expressed genes that were analysed using DAVID Bioinformatics Resources 6.7 (http://david.abcc.ncifcrf.gov/).

