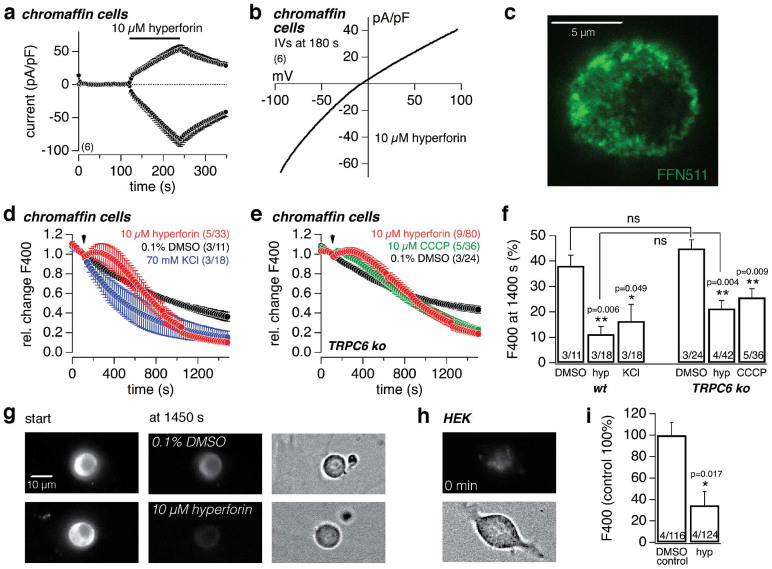
Figure 6. Hyperforin induces membrane currents and depletes and reduces loading of monoamine-containing vesicles in chromaffin cells.
(a) Inward and outward currents at −80 and +80 mV, respectively, from primary mouse chromaffin cells. The bar indicates application of 10 μM hyperforin. Currents were normalized to the cell size and basic currents before application were subtracted. (b) shows the corresponding IV. (c) Confocal picture of FFN511-dependent fluorescence in a chromaffin cell. (d, e) Relative changes of the FFN511-dependent fluorescence (F400, normalized to the value at start of application) in chromaffin cells from wild-type (d) and TRPC6-deficient mice (e). At the indicated time (arrow) 0.1% DMSO, 10 μM hyperforin or 70 mM KCl were applied in (d), and 0.1% DMSO, 10 μM hyperforin or 10 μM CCCP in (e). (f) depicts the statistical analysis of the remaining fluorescence (F400 in d and e) at 1400 s. The asterisks (* p < 0.05; ** p < 0.01) denote a significant difference to the corresponding control in 0.1% DMSO. (g) Representative pictures of FFN511-dependent fluorescence at the start and 1450 s after application of 0.1% DMSO (upper set) or 10 μM hyperforin (lower set) in chromaffin cells. The right panel shows the transmission image of the respective chromaffin cells. HEK cells do not reveal a significant fluorescence after FFN511 loading (h). (i) FFN511-dependent fluorescence (F400) in chromaffin cells after 15 min FFN511 incubation in the absence (0.1% DMSO control normalized to 100%) and presence of 10 μM hyperforin. Data represent means ± S.E.M. of the indicated number of experiments (cells) in (a) and (b), and of the indicated number (n) of experiments including x cells (n/x) in (d, e, f) and (i).

