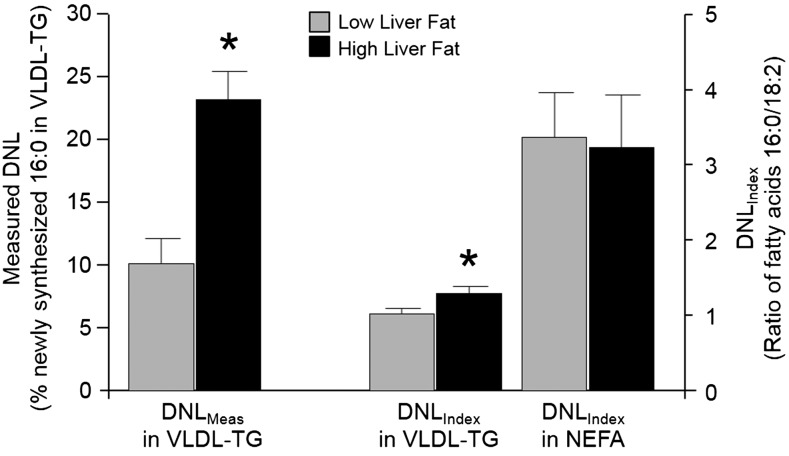
FIGURE 3 .
Comparison of DNLMeas with fatty acid indices of DNL. Data are means ± SDs from subjects with low liver fat (gray bars; n = 11) and high liver fat (black bars; n = 12 for VLDL-TG data and n = 13 for NEFA data). In the literature, the molar ratio of 16:0 to 18:2n–6 is used as a DNLIndex. In this figure, the index is compared with DNLMeas by using deuterated water administration and fatty acid analysis by GC-MS. * P value <0.05 for differences between liver fat groups, analyzed by unpaired 2-tailed t test. DNL, de novo lipogenesis; DNLIndex, index of de novo lipogenesis; DNLMeas, isotopically measured de novo lipogenesis; GC-MS, gas chromatography–mass spectrometry; NEFA, nonesterified fatty acid; TG, triacylglycerol.

