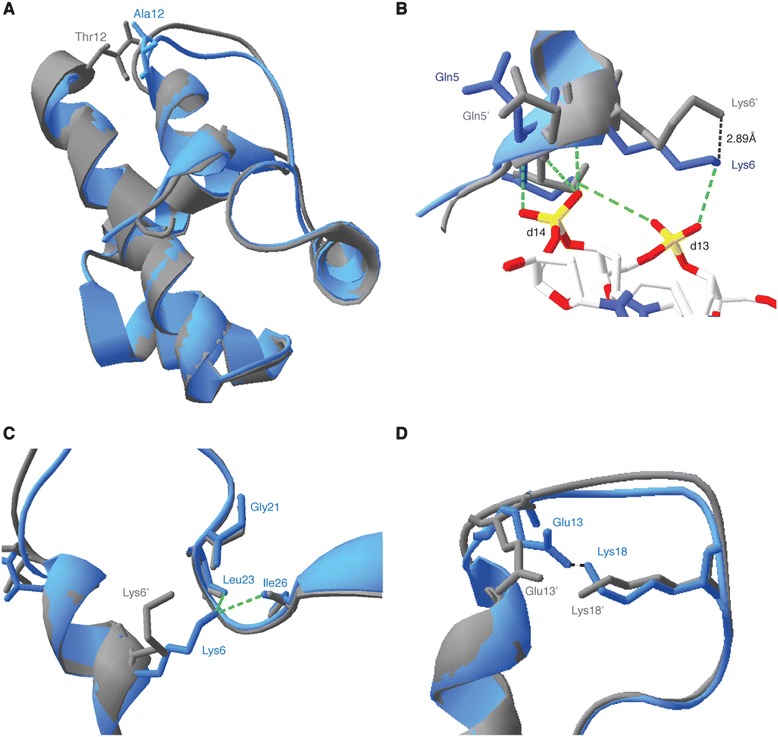
Figure 2.

Structural model of the BANF1 A12T protein. (A- D): BANF A12T modeling predicts fine changes in the position of key amino acids. WT and A12T sequences were used to generate a model using Phyre2 software. The resulting models were fitted on the existing crystal structure of BANF1 bound to DNA (PDB: 2BZF). (A): Superposition of ribbon diagrams of monomeric WT (Blue) and A12T (gray) BANF1, indicating modification of the loop connecting helix α1 and α3. (B): Ribbons diagrams of WT (Blue) and A12T (Gray) BANF1, indicating the hydrogen bonds between Lys6 and Gln5 with DNA nucleotides d13 and d14 DNA (as depicted in PDB: 2BZF). Lys6’ and Gln5’ from BANF1 A12T are seen displaced from their WT counterpart. (C): Ribbon diagrams of WT (Blue) and A12T (Gray) BANF1. Schematics indicate that in the WT, Lys6 protrudes into the pocket formed by Gly21, Ile26 and Leu23. Lys6’ sits outside this pocket in the A12T mutant. (D): Ribbon diagrams of WT (Blue) and A12T (Gray) BANF1, showing the salt bridge between Glu13 and Lys18 in the WT. Glu13’ and Lys18’ are displaced in the BANF1 A12T prediction.
