
Figure 1.
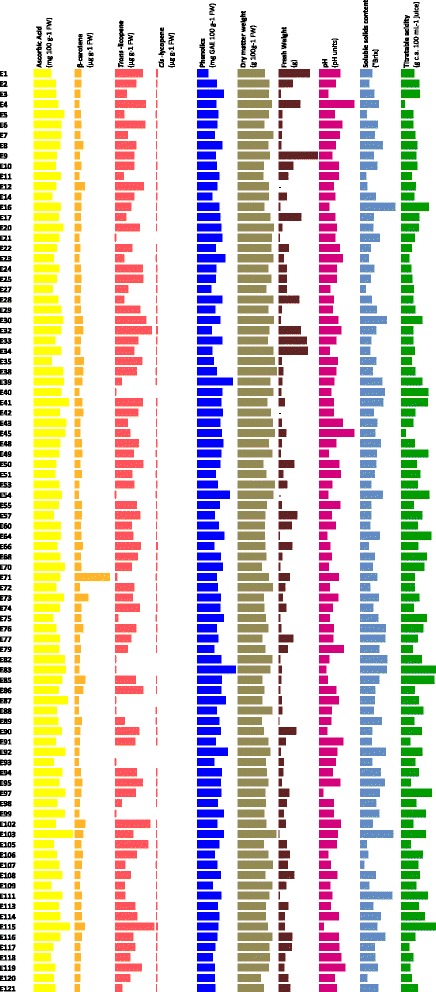
Trend of variation of nutritional and quality traits in the tomato collection. Each bar represents the mean of two years values.
Official websites use .gov
A
.gov website belongs to an official
government organization in the United States.
Secure .gov websites use HTTPS
A lock (
) or https:// means you've safely
connected to the .gov website. Share sensitive
information only on official, secure websites.
Trend of variation of nutritional and quality traits in the tomato collection. Each bar represents the mean of two years values.