
Figure 2.
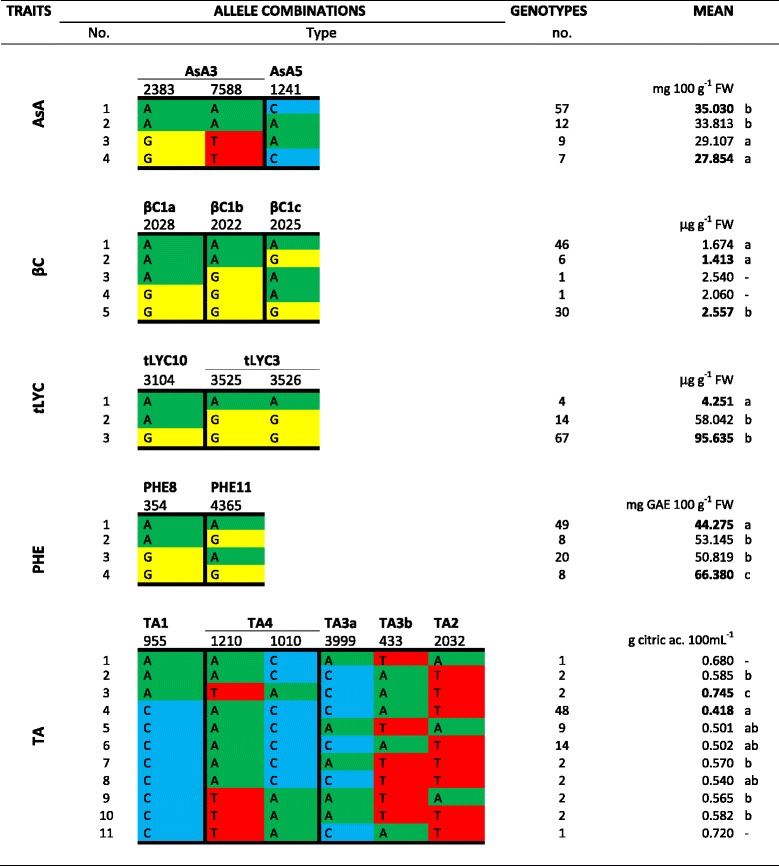
Allele combinations at markers associated with each trait. Number and type of allele combinations, number of genotypes and their mean phenotypic values are shown. Significant differences between groups were assayed by Duncan’s test. AsA = Ascorbic Acid, βC = β-carotene, tLYC = trans-lycopene, PHE = phenolics, TA = titratable acidity.