
Figure 4.
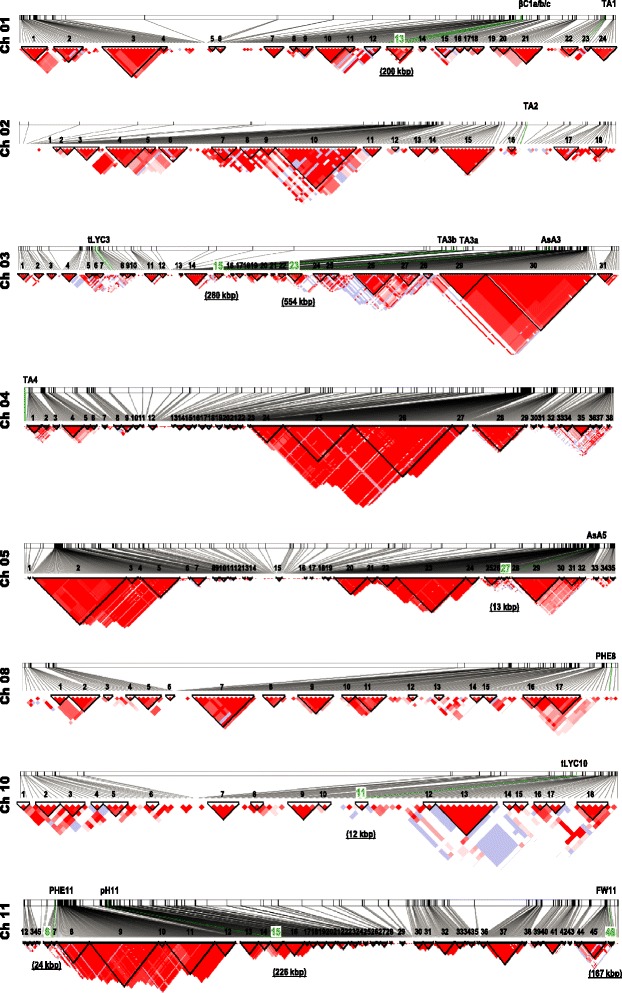
LD Blocks for chromosomes where associated markers were localized. Blocks of markers that are in strong LD using confidence intervals algorithm in Haploview software (black triangle) are reported. The size of blocks (in kbp) in which significantly associated markers fall (green lines) is shown. The colour scheme (D’/LOD) used to represent pairwise LD estimate ranges from bright red (LOD ≥2 and D’ = 1) to white ( LOD <2 and D’ <1).