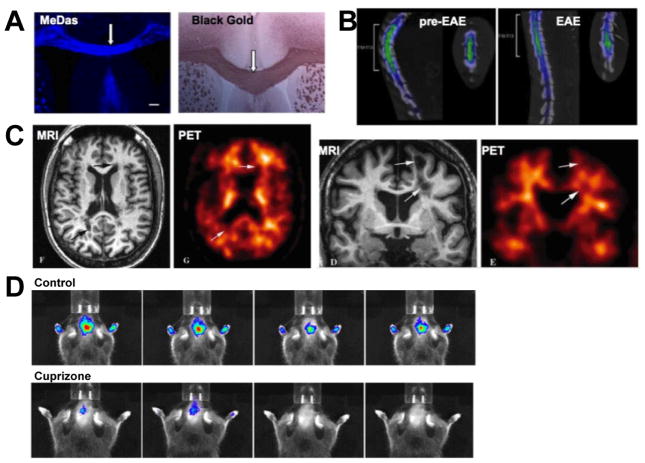
Figure 9.
Molecular imaging of demyelination. (A) In vitro MeDas staining of myelin sheaths in the corpus callosum and comparison with Black Gold staining. (B) 3D PET and CT fusion image of a rat after injection of 11C-MeDas demonstrates decreased tracer uptake in the thoracic spinal cord in EAE versus preimmunized state. (C) PET-MR fusion imaging of demyelination with 11C-PIB in a patient with MS. MS plaques (arrows) and grey matter (arrowheads) sow decreased tracer uptake, suggesting reduced myelin content. (D) Optical near-infrared in vivo imaging of demyelination using the fluorescent compound DBT. In the cuprizone model of demyelination, reduced DBT uptake was detected compared to control mice. (Modified from Wu et al. [220,221], Stankoff et al. [227], and Wang et al. [223] with permission.)

