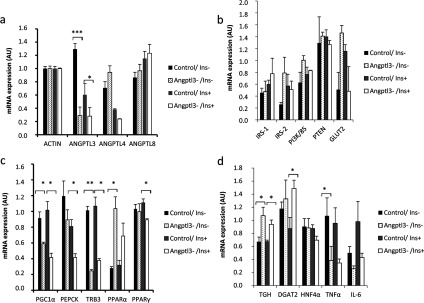
Figure 8. Gene expression patterns in ANGPTL3-silenced and control IHH cells during non-insulin condition (Ins-) and insulin stimulation (Ins+).

(a–d) ANGPTL3-silenced cells and control cells were incubated with 5.5 mM glucose and 100 nM insulin (+/−) for 24 h followed by total RNA extraction from cell lysates, cDNA synthesis and q-PCR (AU, arbitrary unit).
