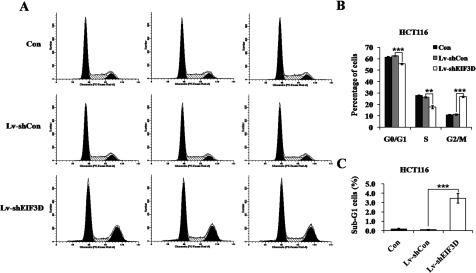
Figure 3. Down-regulation of eIF3D induces cell-cycle arrest as well as apoptosis.

(A) Cell-cycle distribution of HCT116 cells was analysed by FACS. (B) The percentage of HCT116 cells in G2/M phase was significantly higher in Lv-shEIF3D group than that in control groups. (C) The percentage of HCT116 cells in sub-G1 phase was significantly higher in Lv-shEIF3D group than that in control groups. **P<0.01, ***P<0.001, compared with Lv-shCon.
