
Figure 4. Alterations of protein modification are detected through intracellular signalling assay.
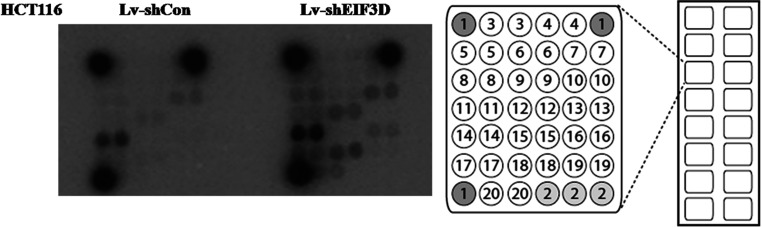
Modifications of effector proteins were analysed in HCT116 cells from two groups. The data could be directly read out from the spot intensity showed in the left graph. The distribution of 20 protein modifications in one chip was shown in the right graph.