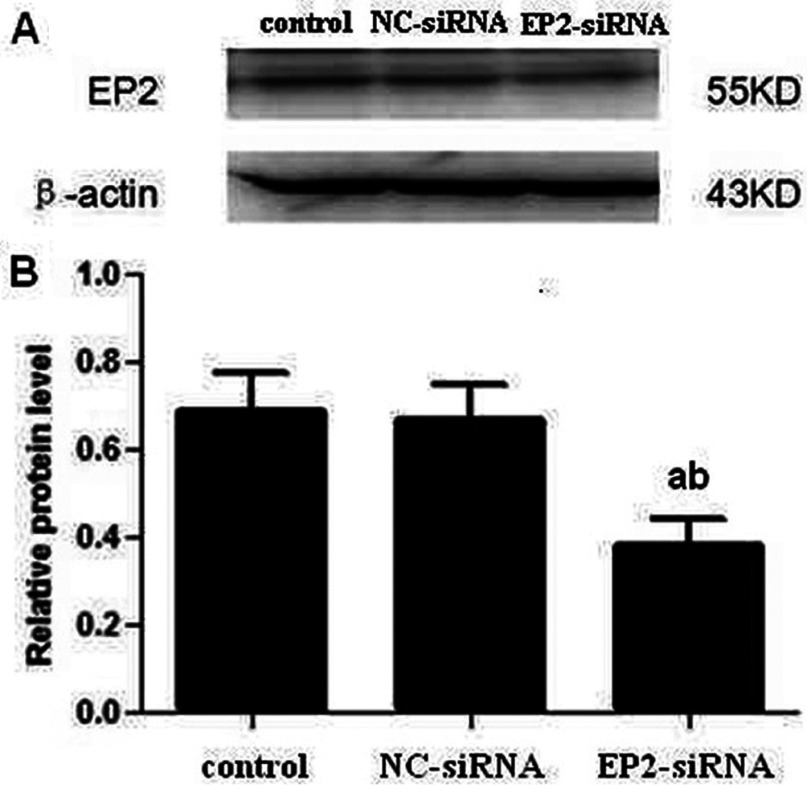
Figure 2. Expression of EP2 in different treated mouse MCs.
(A) Expression of EP2 in EP2-siRNA transfected MCs was detected by Western blot. (B) Quantification of EP2 expression is achieved using densitometric values normalized to β-actin levels (aP<0.01 versus control group; bP<0.05 versus NC-siRNA group).

