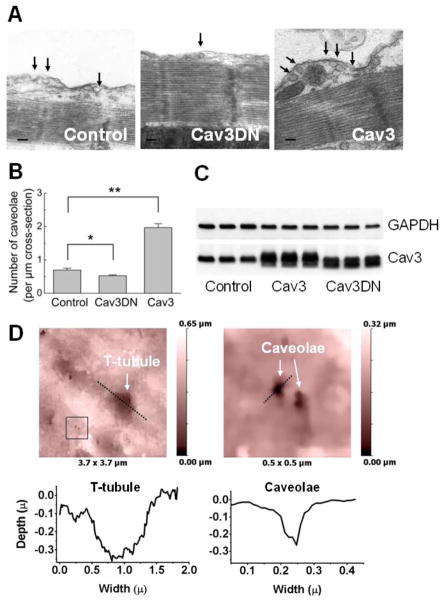
Figure 1. Cav3 overexpression increases caveolae number, while the expression of the dominant-negative Cav3 mutant slightly decreases it.
A) Representative electron microscopy image of longitudinal cardiomyocyte sections showing caveolae (marked with black arrows) in control cells (infected with LacZ adenovirus) as well as in cells overexpressing wildtype Cav3 or Cav3DN mutant (all at MOI 500).
B) Quantification of the number of caveolae per μm cross-section of the membrane from the electron microscopy images. Data are means ± SE, n=4–5 per condition. *, ** - Differences are significant at P<0.05 or 0.01, respectively.
C) Western blots analysis of the Cav3 overexpression 48 h after transduction with the control (LacZ), Cav3 or Cav3DN adenoviruses (all at MOI 500).
D) High resolution SICM image of an ARVM overexpressing Cav3 (MOI 500) which shows clearly visible caveolae.

