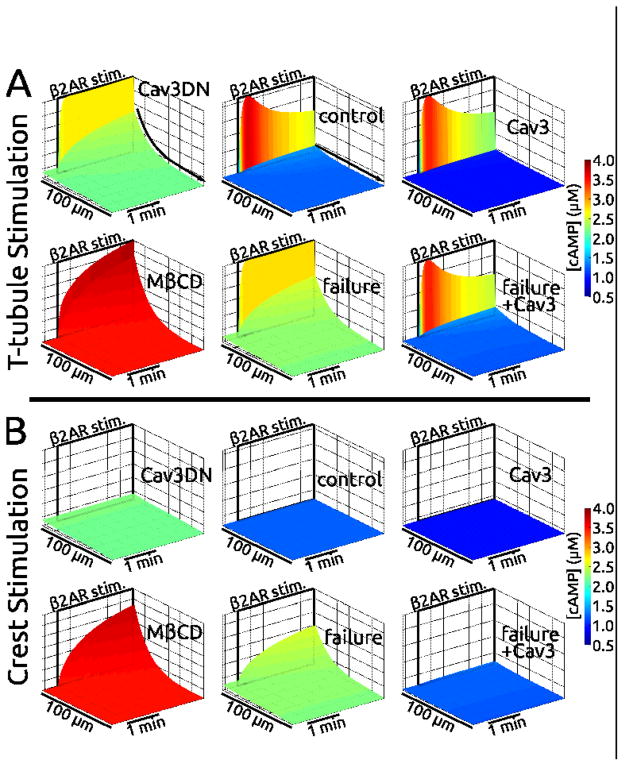
Figure 6.
Simulations based on the relationships proposed in Figure 5 qualitatively reproduced cAMP experimental measurements. Shown are surface maps of cAMP concentration at the membrane ([cAMP], from 0.5 to 4 μM) along the cell length (100 microns) during the time just prior to and minutes following β2AR stimulation. Stimulation was at distal T-tubule (panel A, top) or distal crest sites (panel B, bottom) — indicated in space and time by black rectangles labeled “β2AR stim.”. The protocol was designed to mimic experiments shown in Figures 3C, D, E and 4D. Results for control, Cav3 overexpression, Cav3DN, MβCD, heart failure, and heart failure with Cav3 overexpression are shown. Cases are arranged as in Figure 5. A) Following Ttubular stimulation, cAMP was robustly generated at the stimulus site in all cases. However, it did not diffuse in control, Cav3, and failure+Cav3 cases (flat [cAMP] landscapes, “no diffusion” straight arrow). Pathological diffusion was exhibited by Cav3DN, MβCD, and heart failure (contoured [cAMP] landscapes, “diffusion” curved arrow). B) Crest stimulation did not always generate cAMP: e.g. the non-disease cases of control and Cav3, but also Cav3DN and failure+Cav3 cases. cAMP was generated following crest stimulation for MβCD and failure cases, and it diffused along the cell. Color scales are the same for all cases. Z-axes scales are the same for each case.

