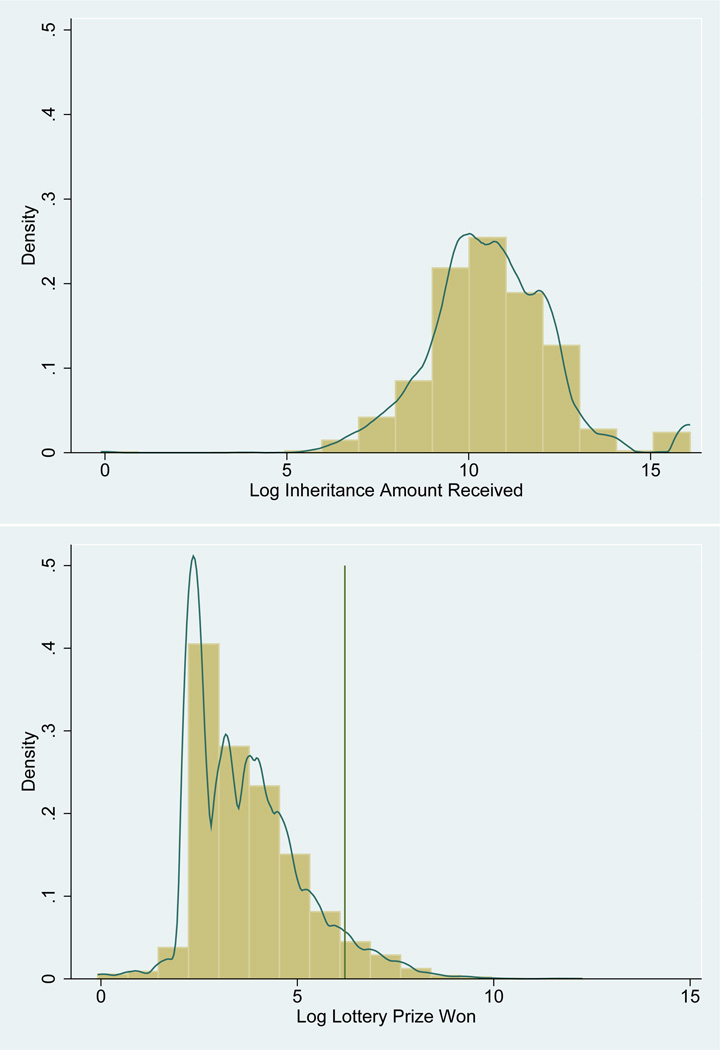
Figure 1.
Distribution of the logarithm of inheritance amounts in US dollars in the HRS (top) and of lottery prizes won in British pounds in the BHPS (bottom). The bar graphs show the data binned in 16 discrete units of the amount inherited and the log of the prize won, and the solid curves are Epanechnikov kernel densities. The vertical bar in the bottom Figure corresponds to 500 British pounds, above which lottery winnings are defined as big.

