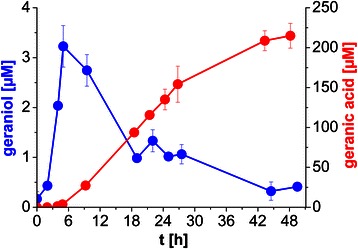
Figure 4.

Production of geraniol and geranic acid by P. putida DSM 12264 expressing GES and MVA. Indicated are the concentrations of de novo produced geraniol (blue) and geranic acid (red) over time using P. putida DSM 12264 expressing GES and MVA. Cells were grown in shake flasks in E2 medium (containing 10% LB, 30 mg/L kanamycin and 9.2 g/L glycerol) at 30°C and heterologous gene expression was induced 3 h after inoculation with 0.2% (w/v) L-rhamnose. Geraniol and geranic acid concentrations were determined via HPLC over time. Mean values of two independent experiments, indicated by error bars, are given. For detailed statistical analysis, please see Additional file 4.
