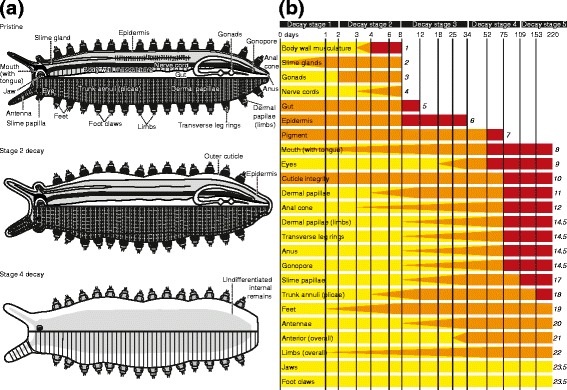
Figure 1.

Anatomy and decay of Onychophora. (a) Idealized external (lower half) and internal anatomy (upper half) of Onychophora based on that of E. rowelli, with key anatomical characters labelled. Shown immediately post-mortem (upper), at the end of decay stage 2 (centre) and at the end of decay stage four (lower), to illustrate character loss and morphological deformation. (b) Decay sequence through time. Yellow = ‘pristine’; orange = ‘decaying’; red = some ‘lost’; bars terminate at first sampling interval where all are lost. Characters were initially ranked based on the timing of complete loss. Where this resulted in tied ranks, ties were broken based on the time of onset of loss. Remaining ties were broken based on the time at which all samples of a character exhibit decay, then the time of onset of decay. Rankings quoted at the termination of each bar.
